First of all, sorry for yesterday but Over-blog was partially down for the whole day. So, I was unable to upload any charts. This is why I didn't post any update.
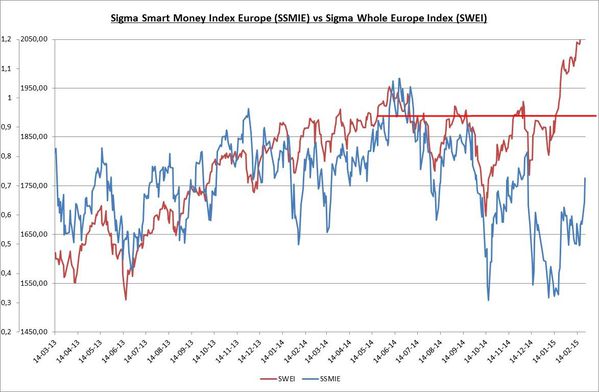
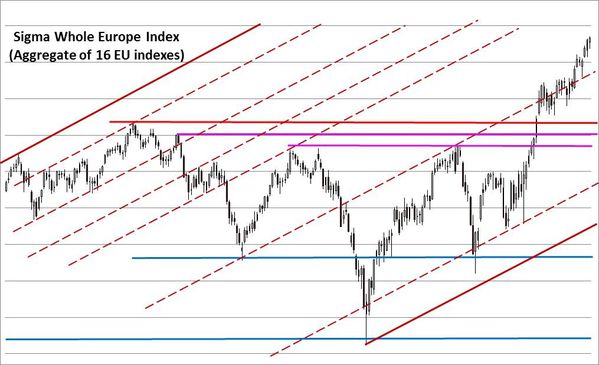
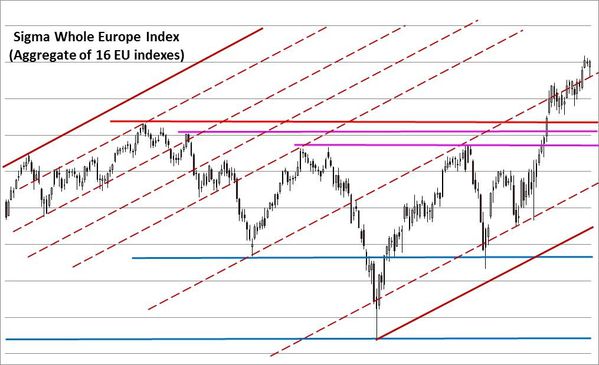
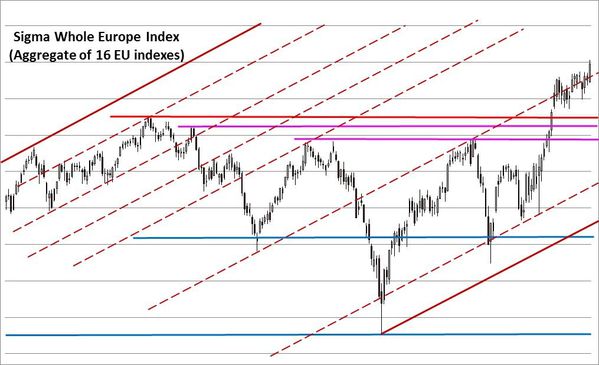
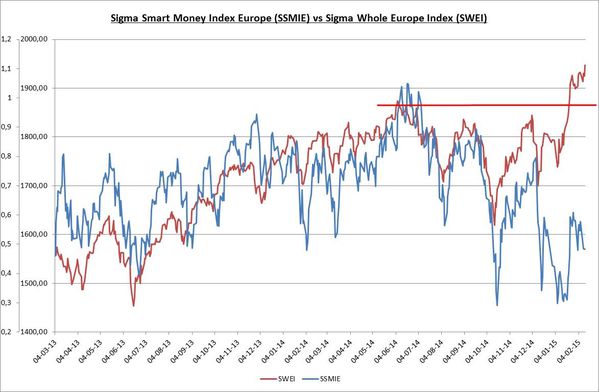
The Sigma Whole Europe Index continues to move higher and higher in a nearly vertical pattern: ~= +30% since mid-October!!!! Mmmmm, thanks M. Draghi, short term you are a master but long term someone will have to pay the bill....
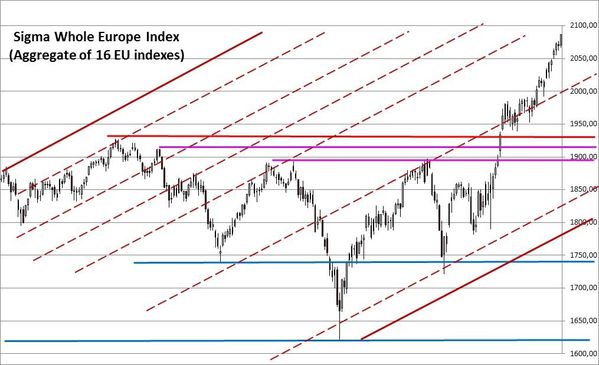
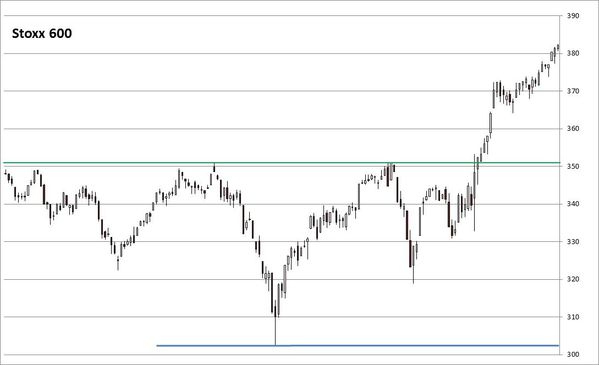
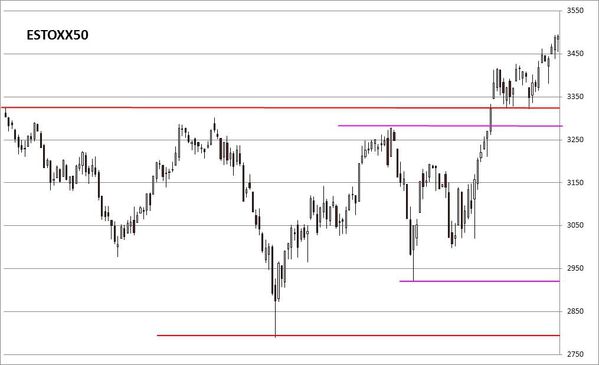
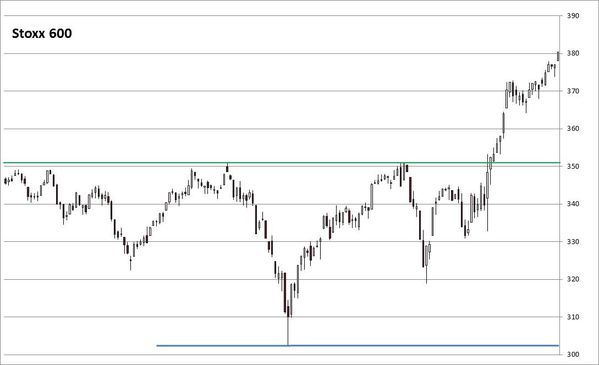
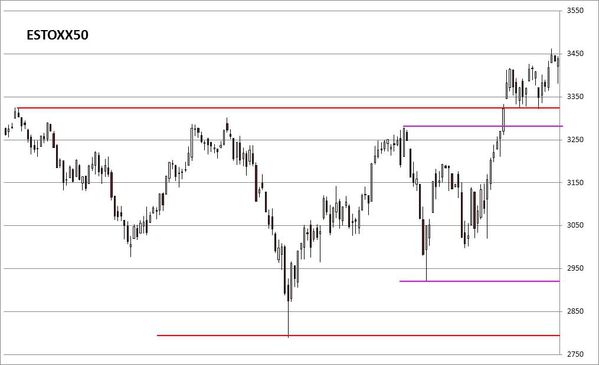
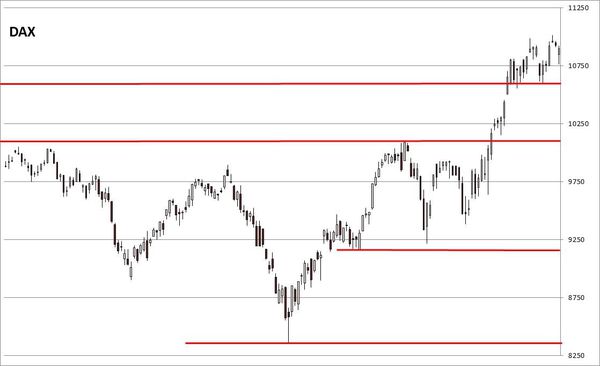
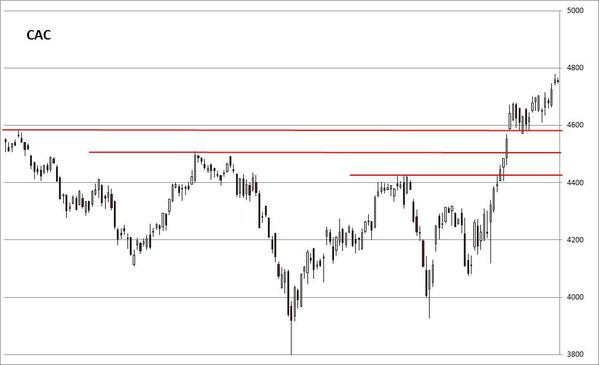
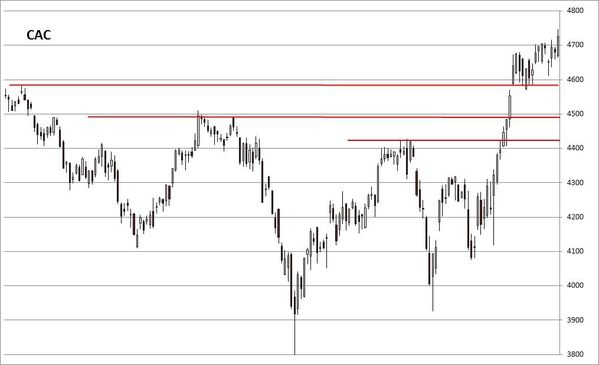
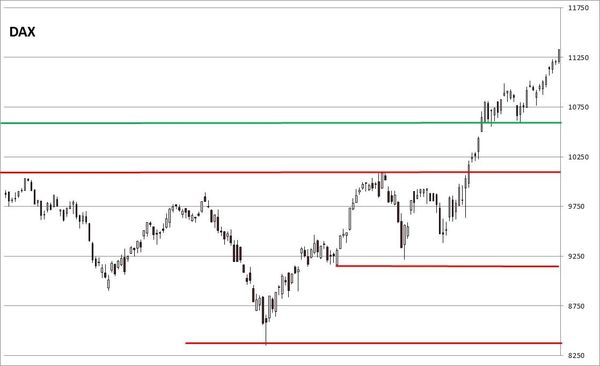
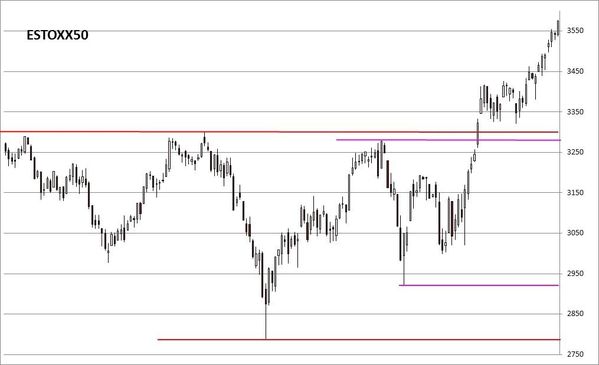
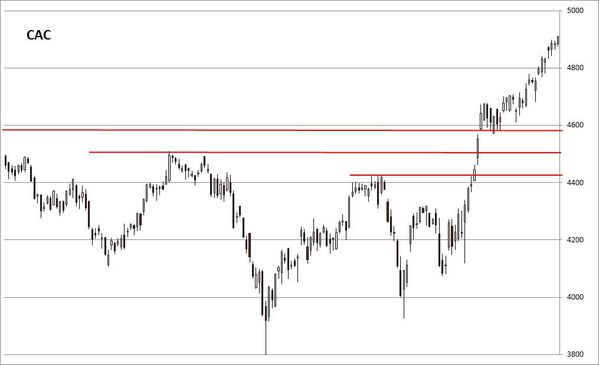
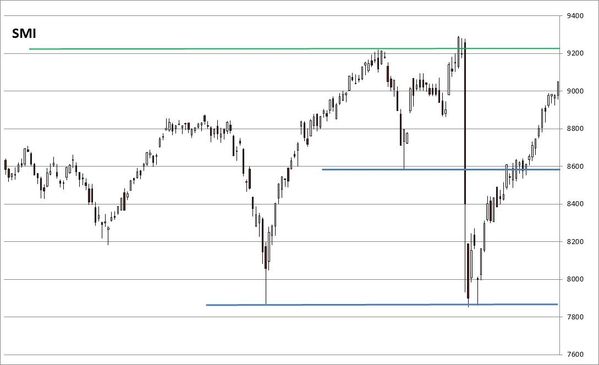
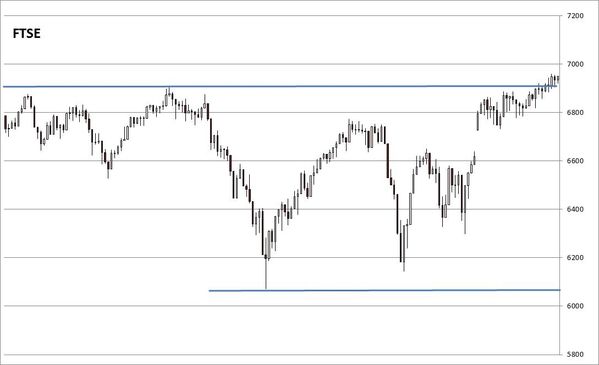
Looking at key European Indexes, we can notice the vertical pattern on all charts:
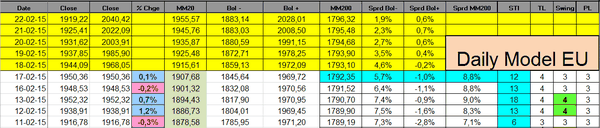
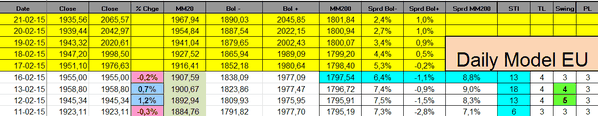
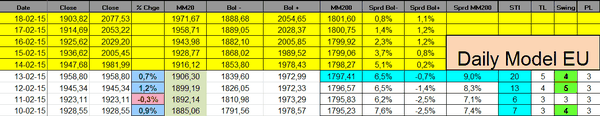
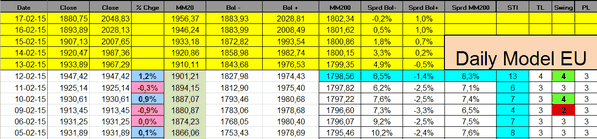
Nevertheless, the Sigma Trend Index Europe starts to show some signs of weakness. A negative divergence appears between the Sigma Trend Index Europe and the Sigma Whole Europe Index. This is a major warning for the European equity market.
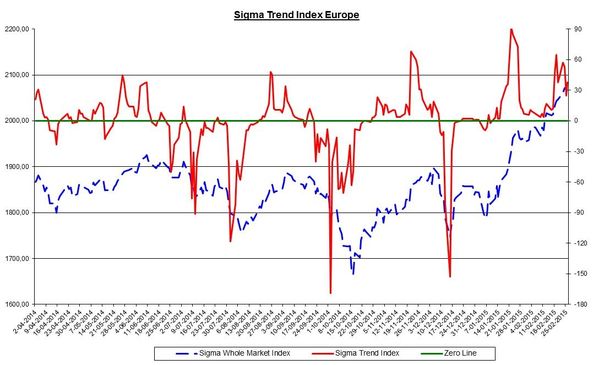
The Sigma Trend Index remains above its key '34' level for the 6th time in 7 sessions. This kind of overheating is short term impressive but highly dangerous on a medium term basis.
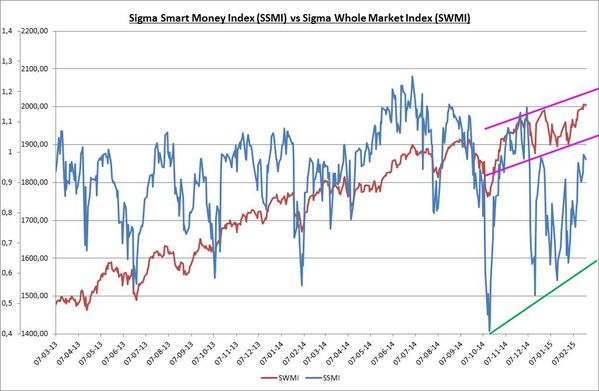
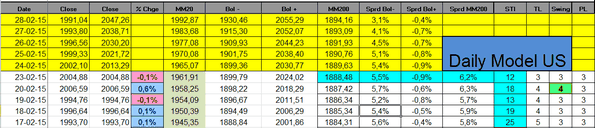
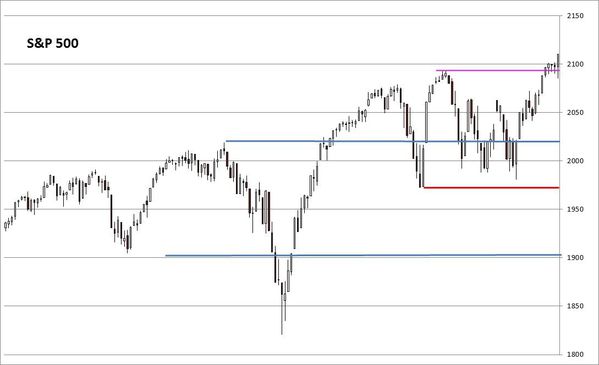
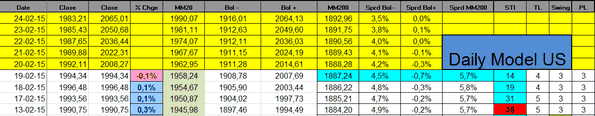
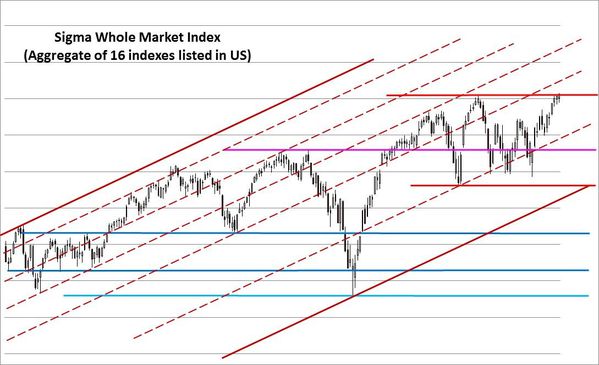
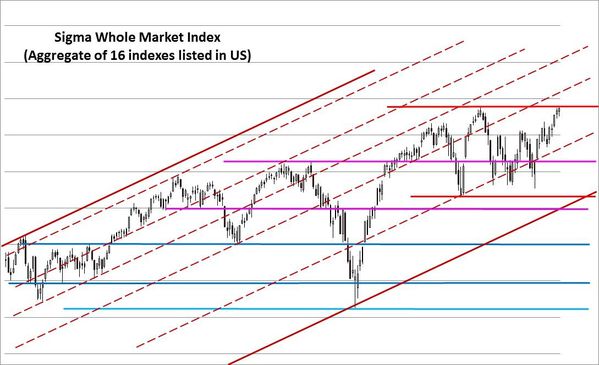
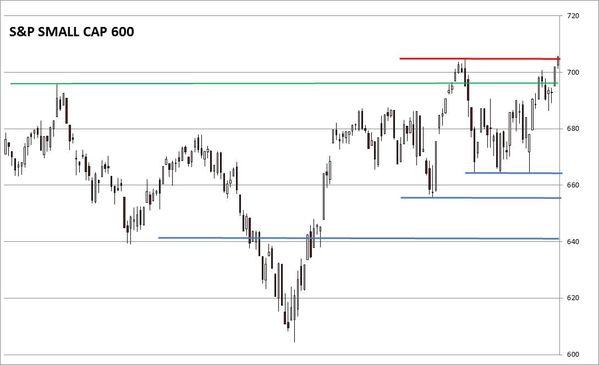
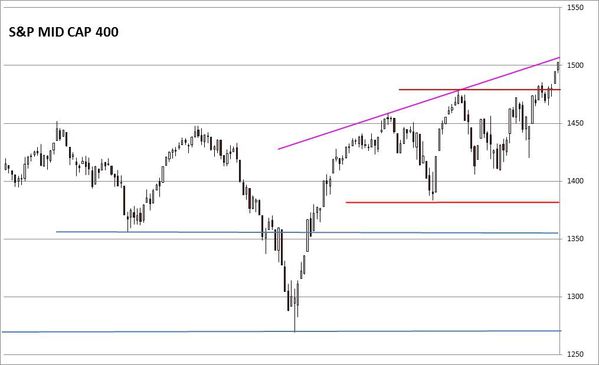
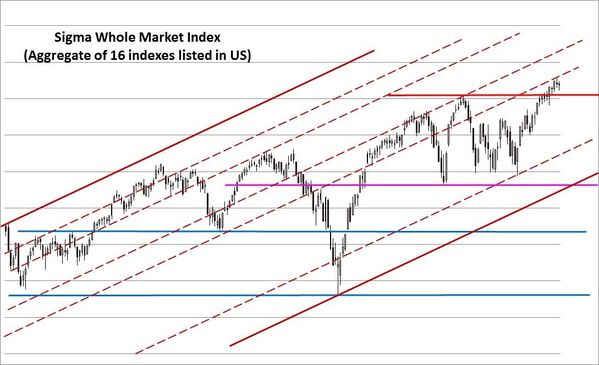
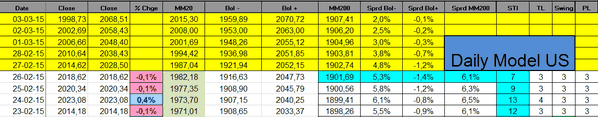
The Sigma Whole Market Index remains strong and as long as it remains above the red horizontal support, there is no danger for US markets.
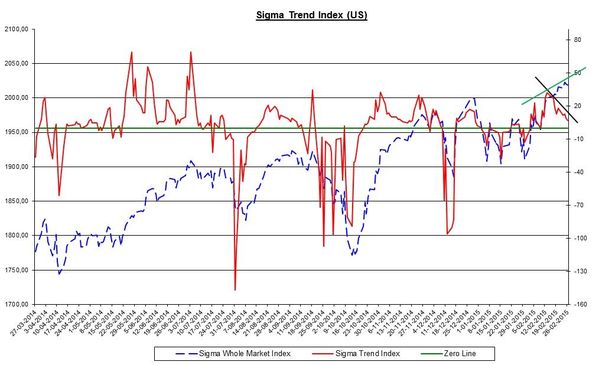
Nevertheless, we can see some clouds on the horizon. First of all, there is an important negative divergence between the Sigma Trend Index and the Sigma Whole Market Index. This is not good.
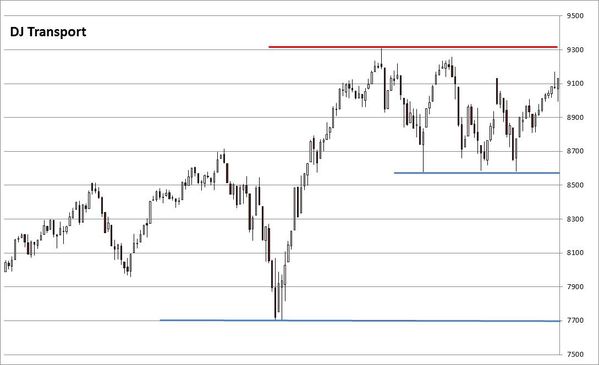
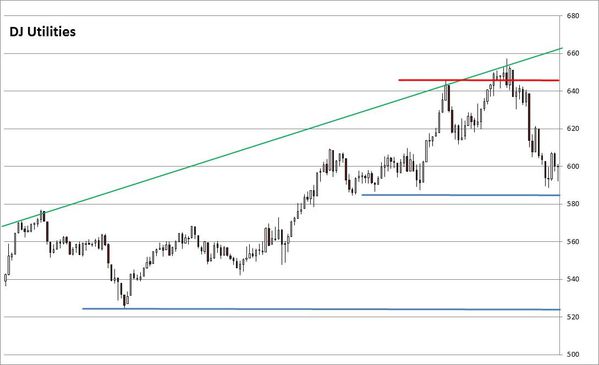
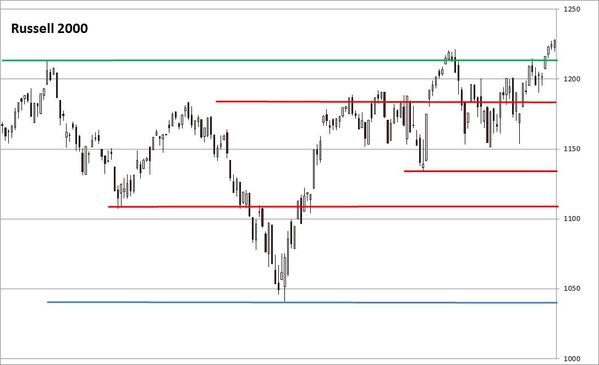
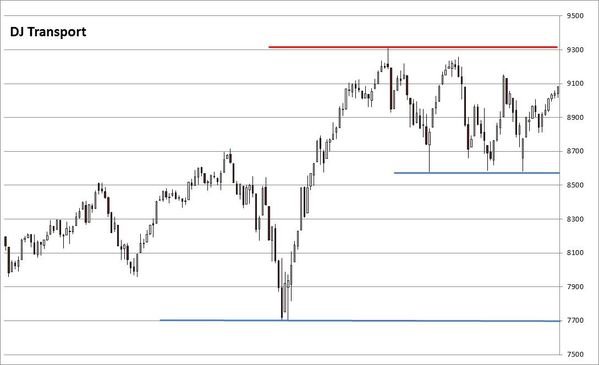
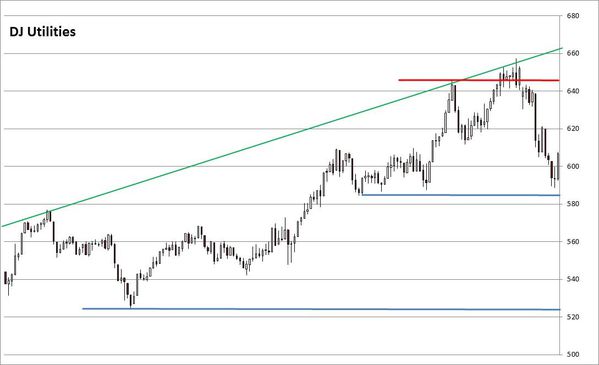
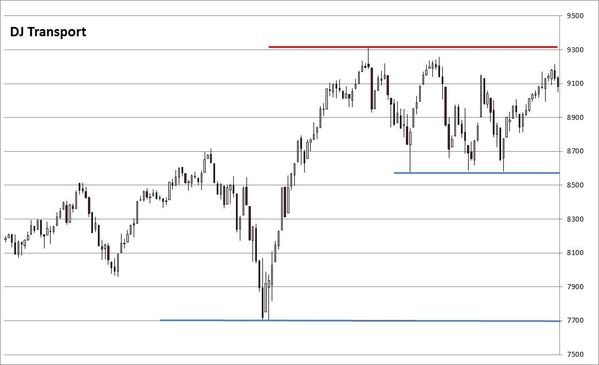
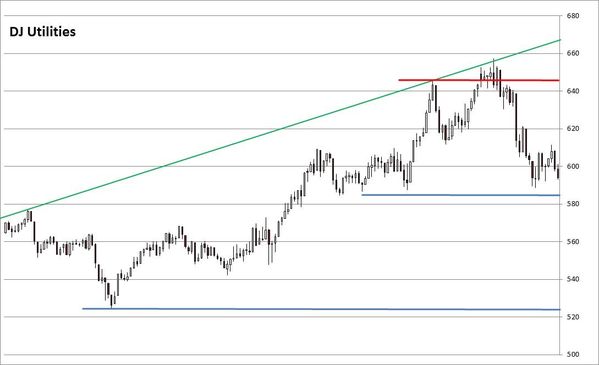
Secondly, some major indexes don't confirm recent strength and were not able to print new highs. This is something to carefully monitor.
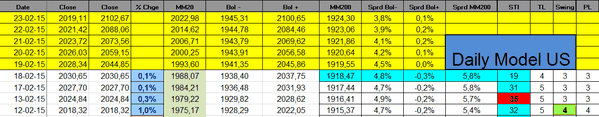
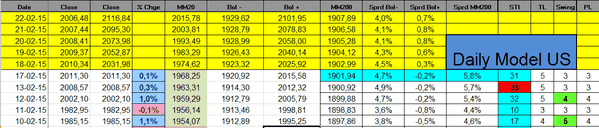
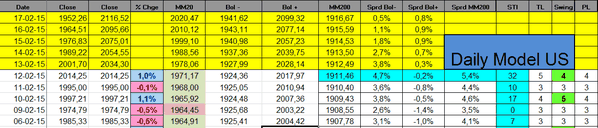
The Sigma Trend Index continues to slide and it is now close to its zero line. Other indicators are neutral at '3'.
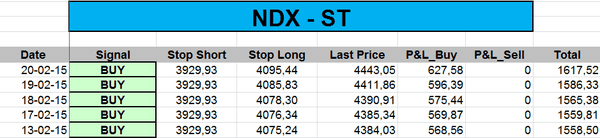
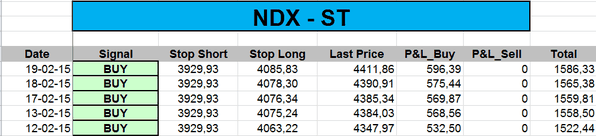
The ST model uplifted its stop on the NDX:
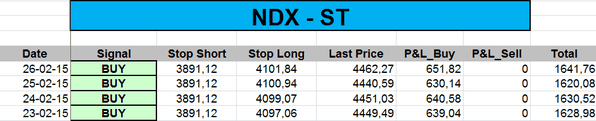
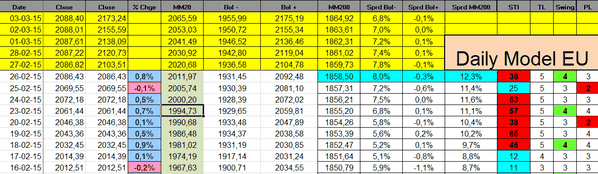
Daily Trading Book: