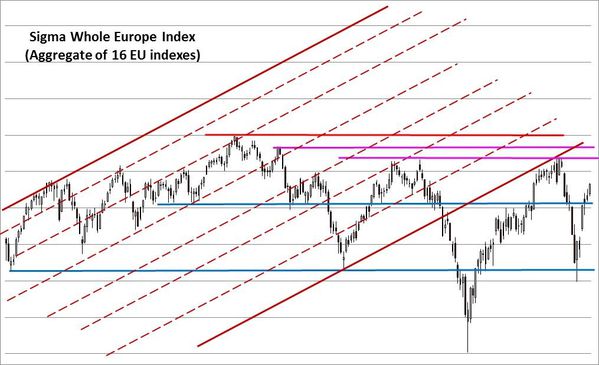
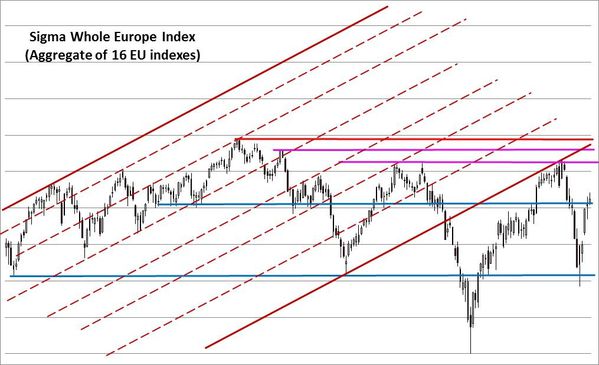
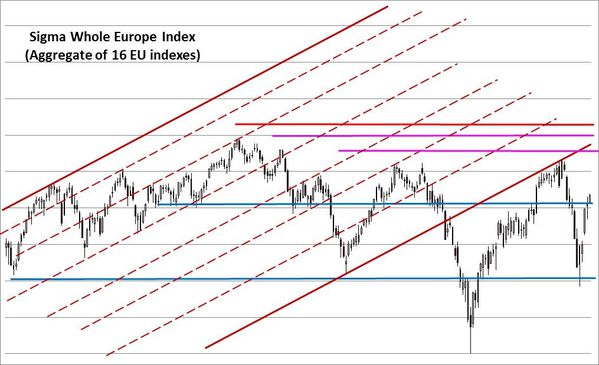
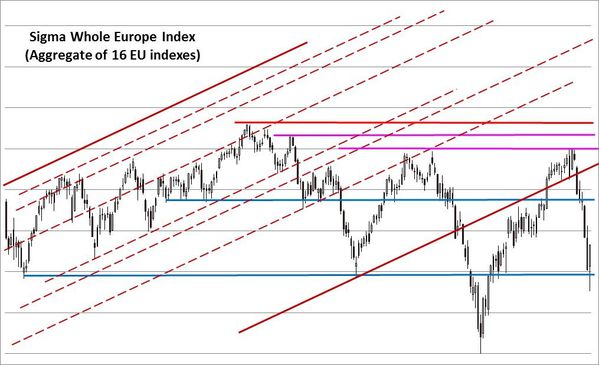
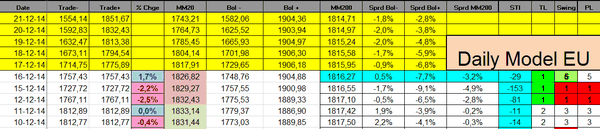
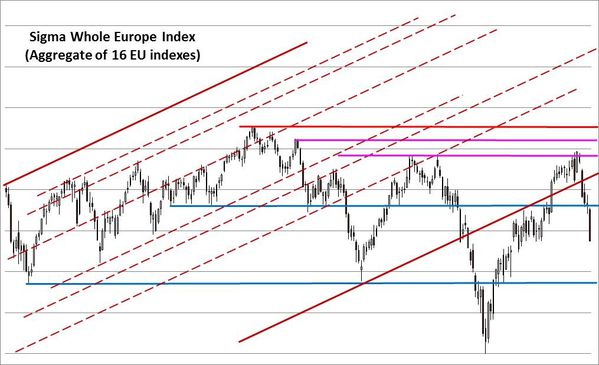
The Sigma Whole Europe Index continues to rebound but it remains well below its annual record. Current rebound remains unconvincing (for me).

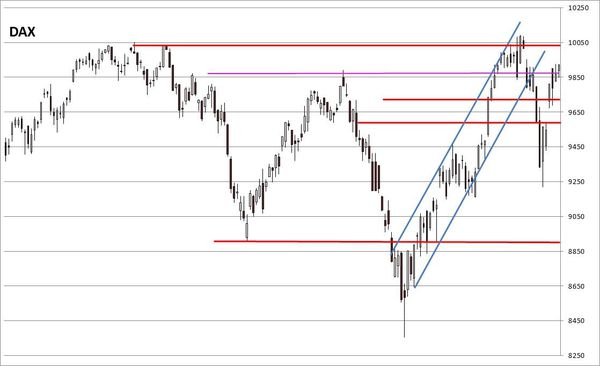
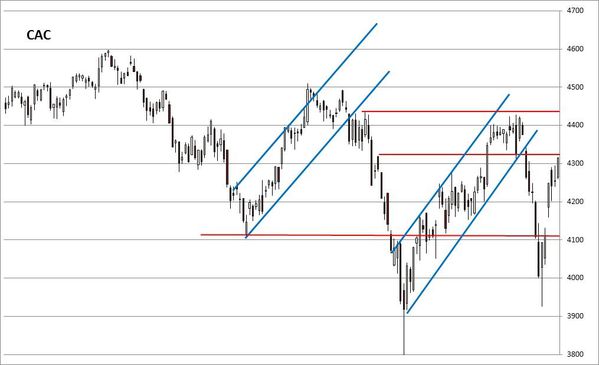
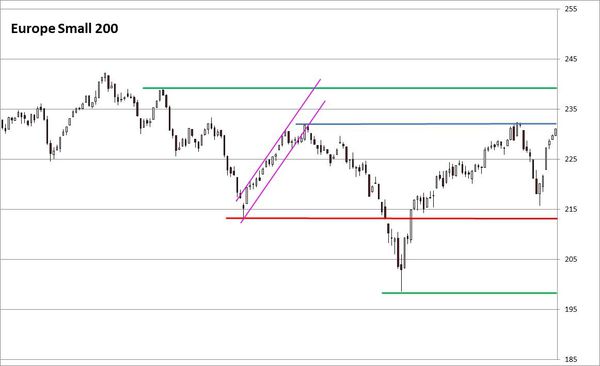
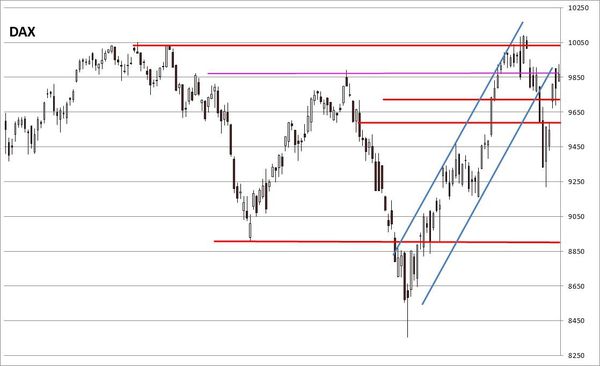
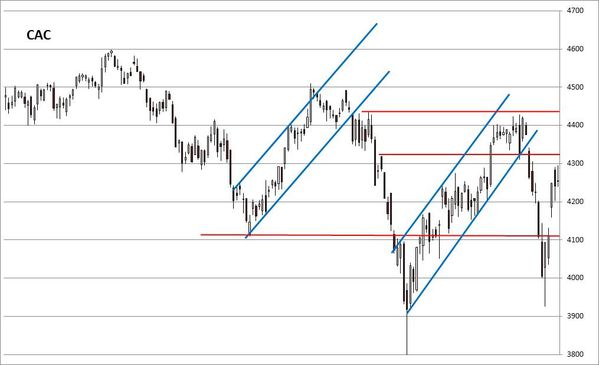
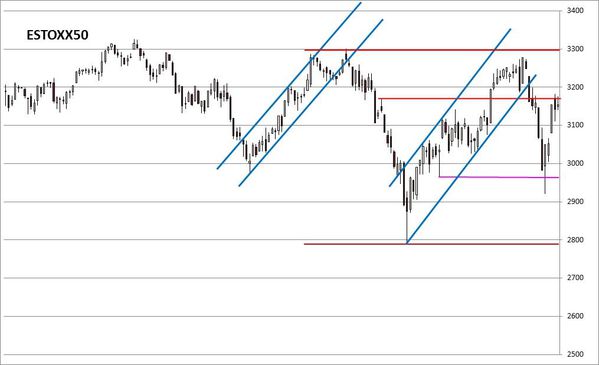
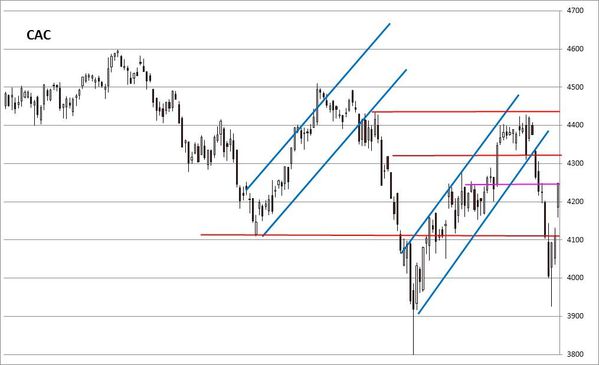
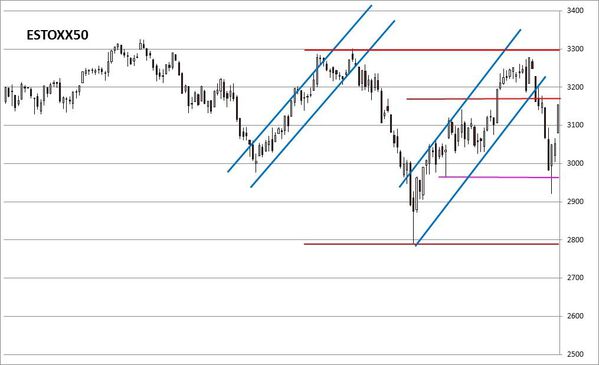
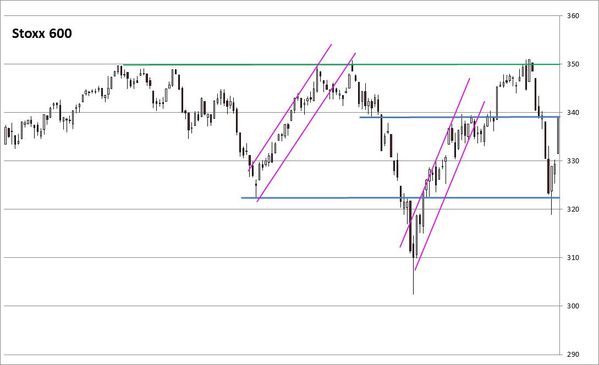
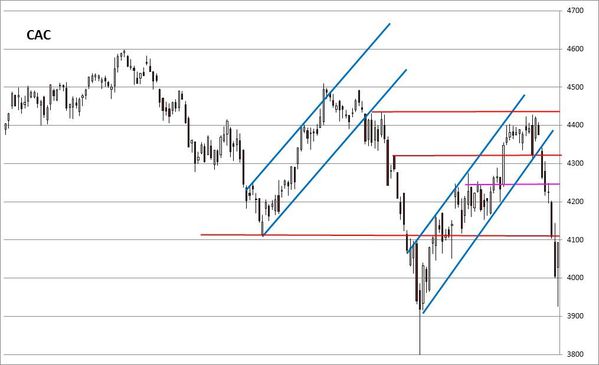
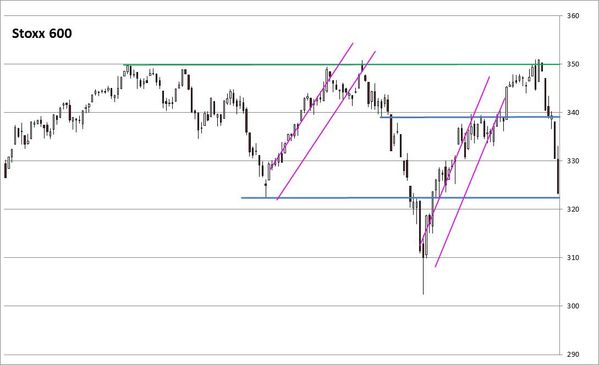
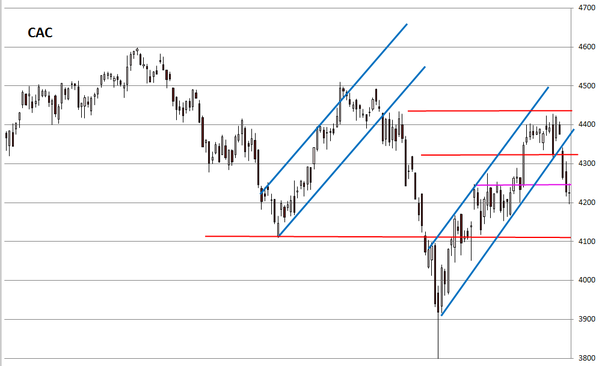
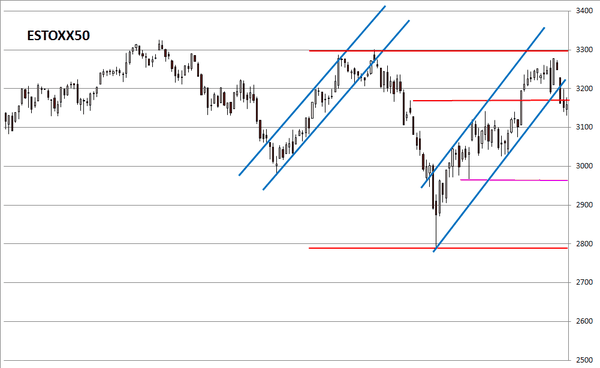
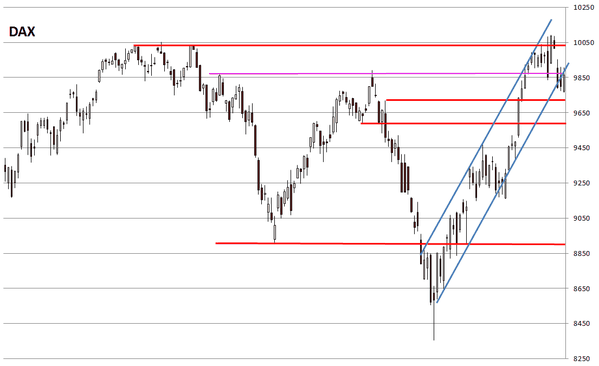
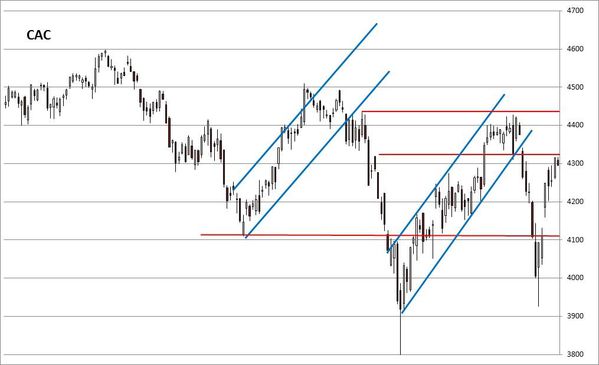
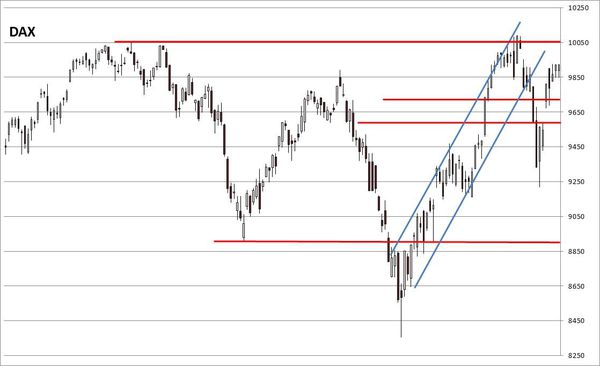
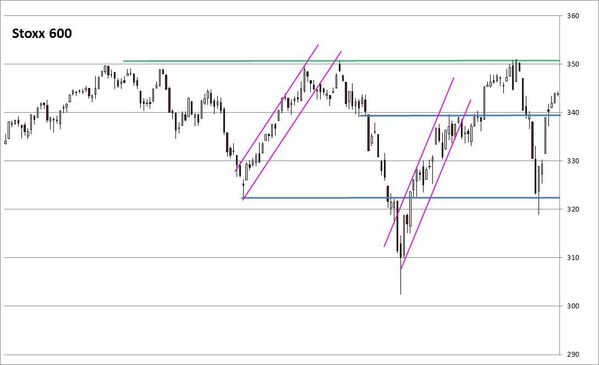
Looking at some European indexes, the situation is the same: most indexes are at critical levels and it would be very important to move higher in order to generate a new up leg.

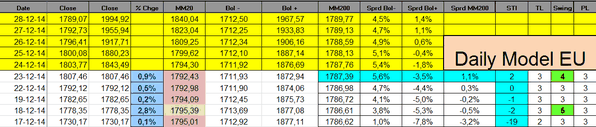
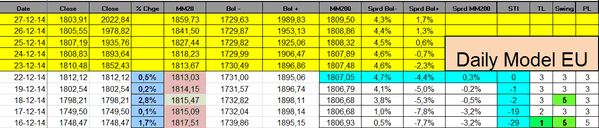
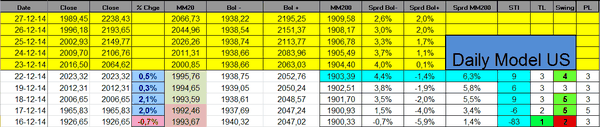
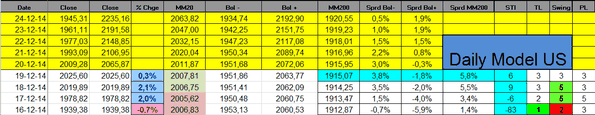
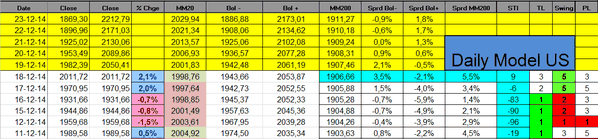
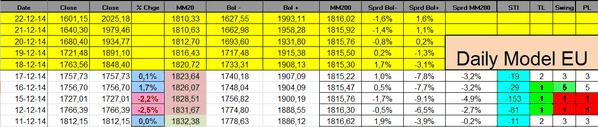
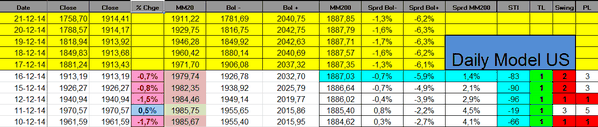
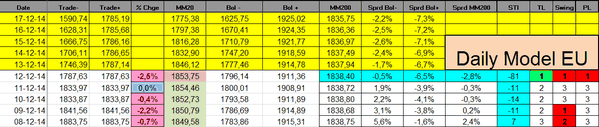
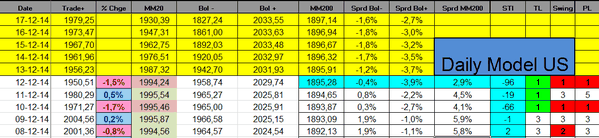
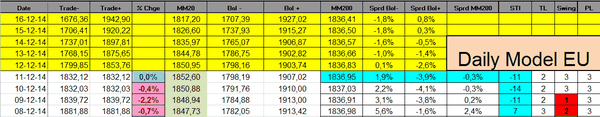
The Sigma Trend Index is in positive territory (at '2') other indicators are neutral at '3'.

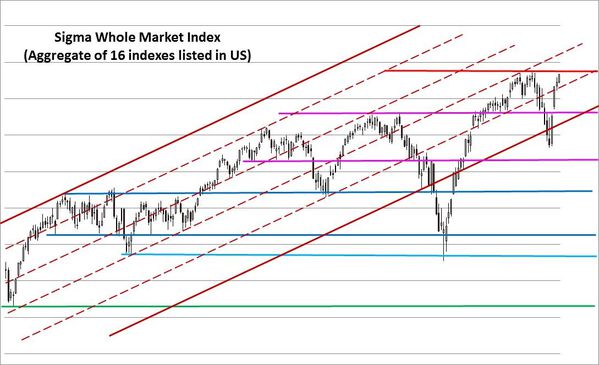
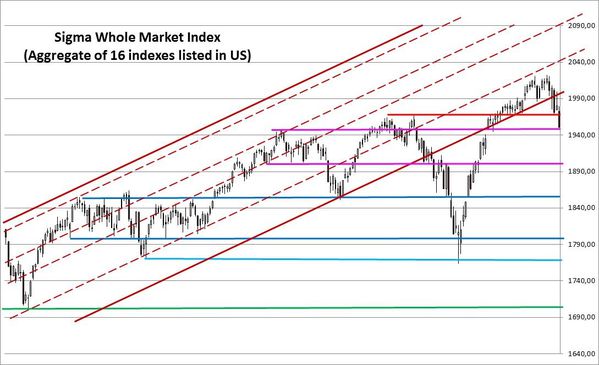
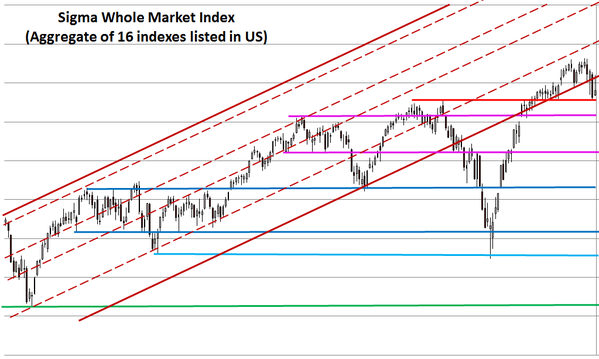
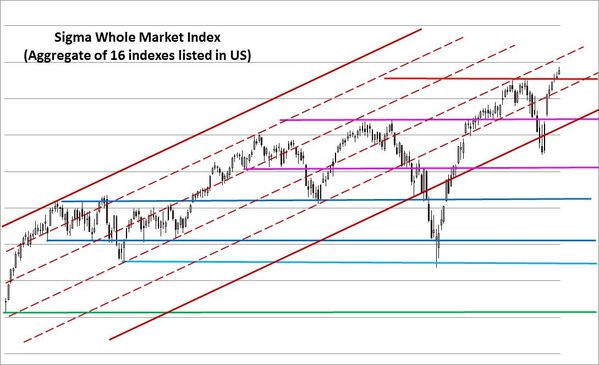
The Sigma Whole Market Index printed a new record and was able to close the week above the red horizontal resistance. This is positive.
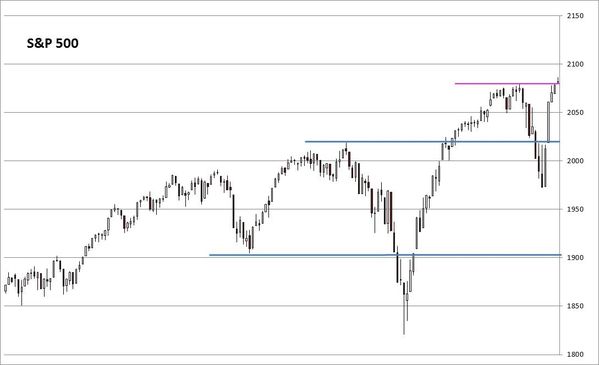
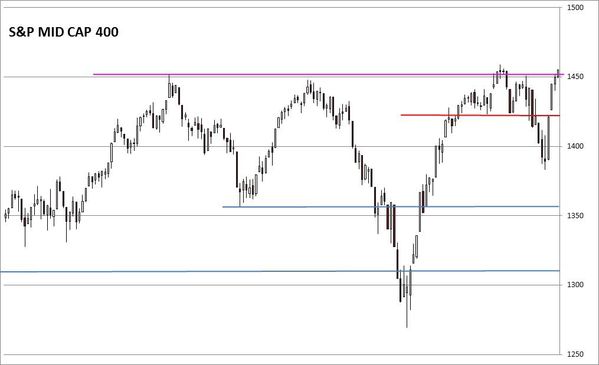
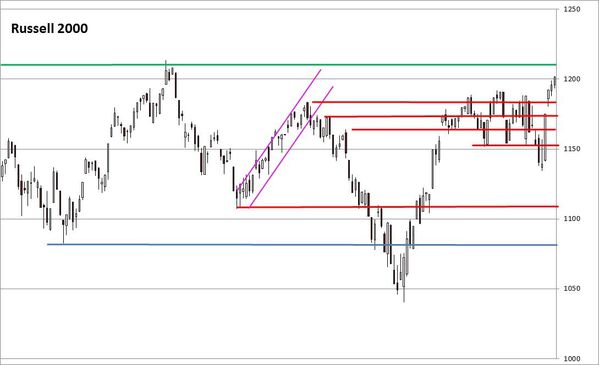
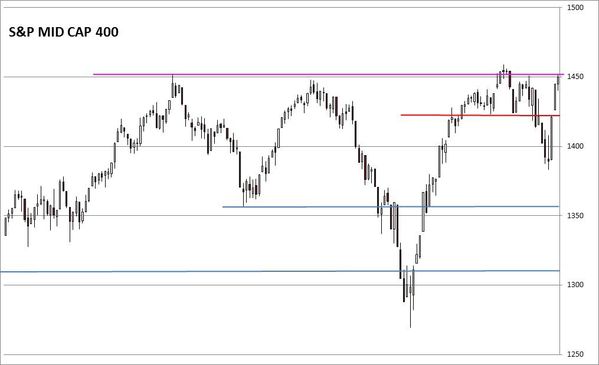
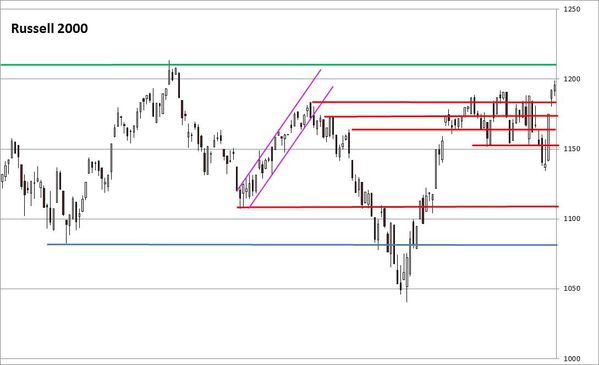
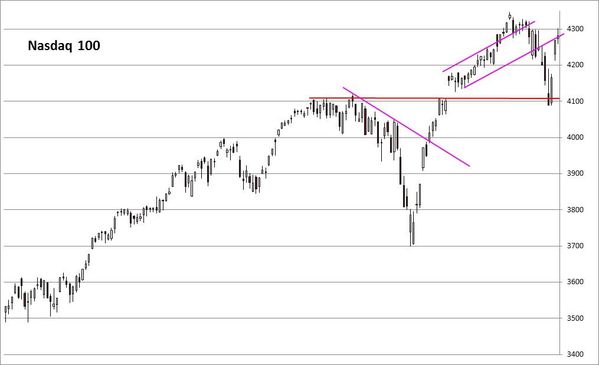
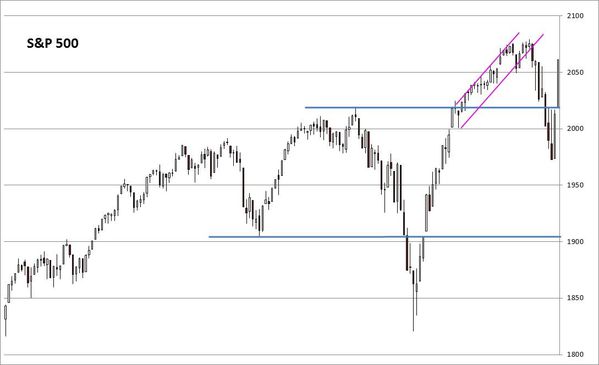
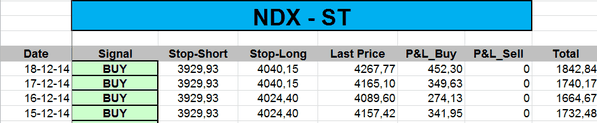
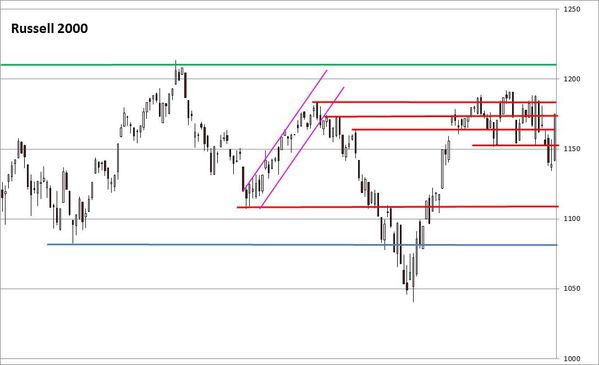
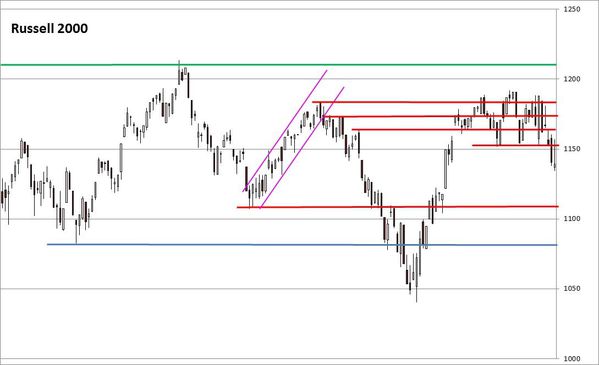
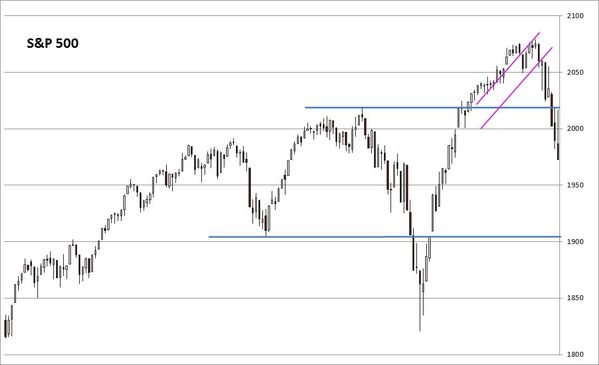
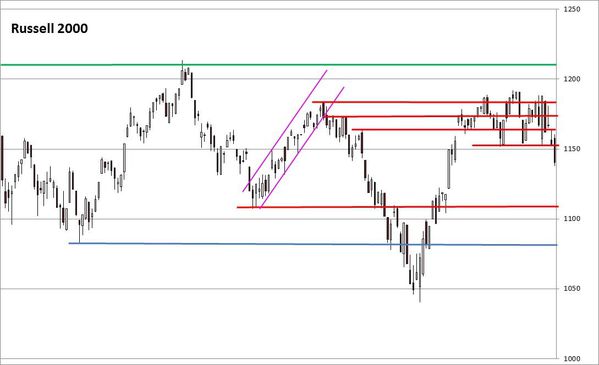
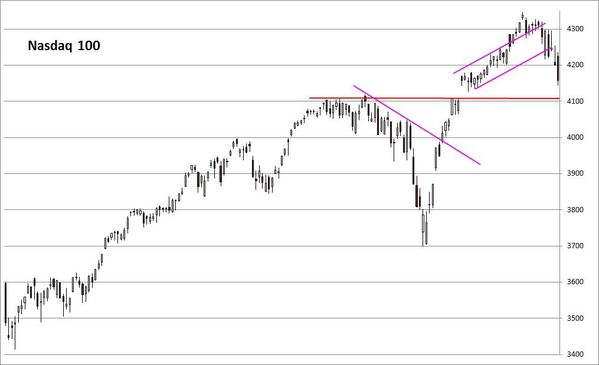
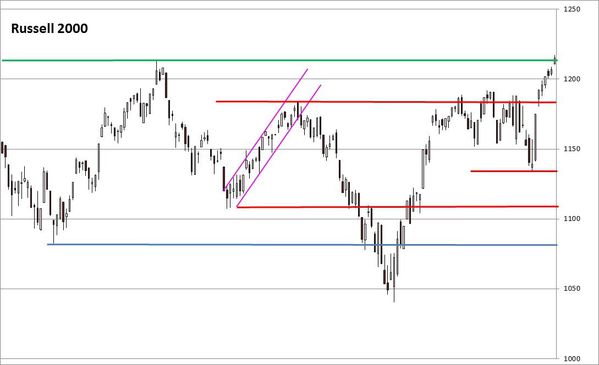
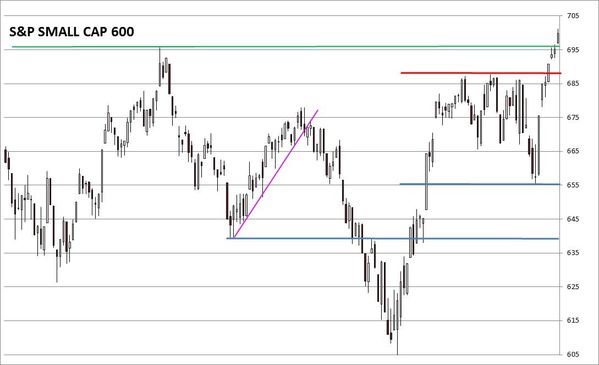
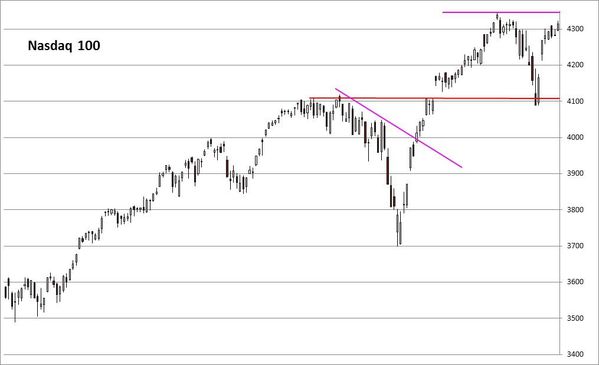
Looking at some US indexes, we can notice that both the Russell2000 and the Small Cap600 were finally able to print new record highs. The NDX is losing some of its momentum but there is no major danger at this stage: the double top scenario on the NDX is something to monitor.
The Sigma Trend Index remains well above its zero line but we are far from the key '34' level (required level in order to generate a sell signal).
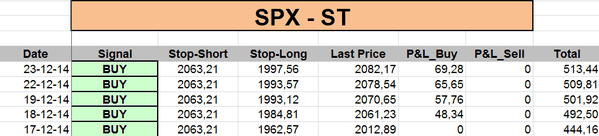
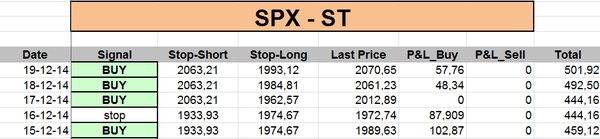
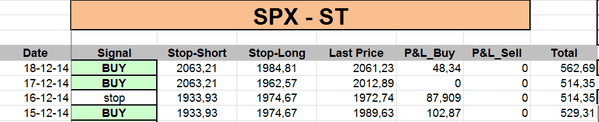
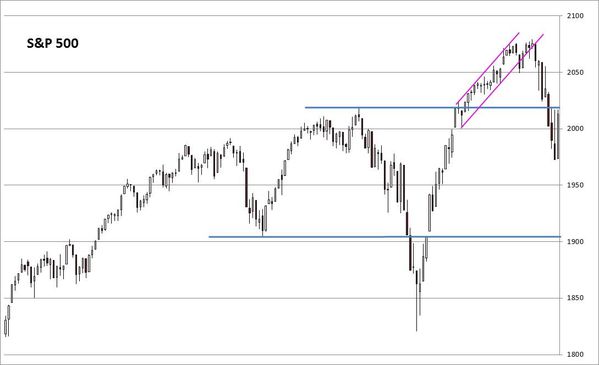
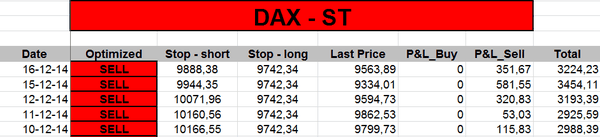
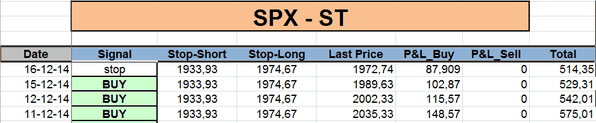
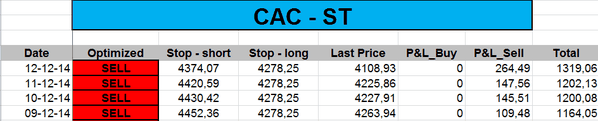
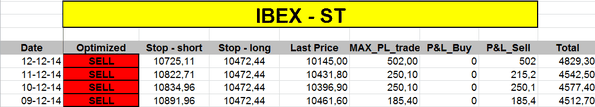
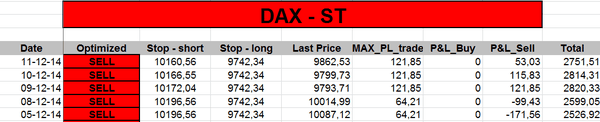
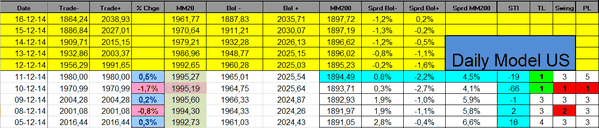
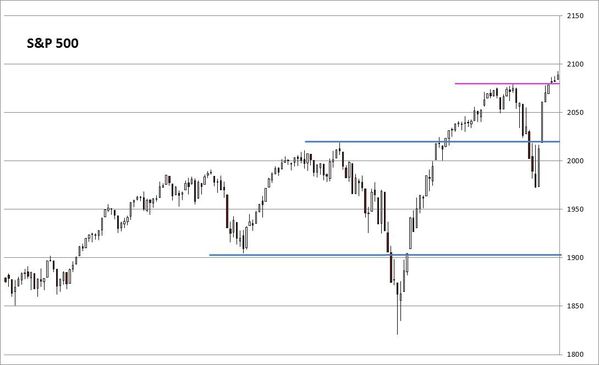
The ST model uplifted its stop on the SPX.