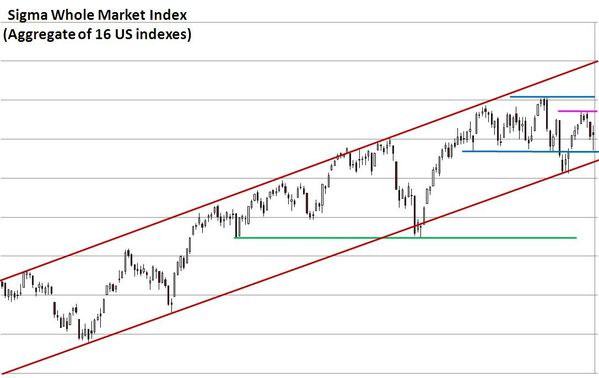
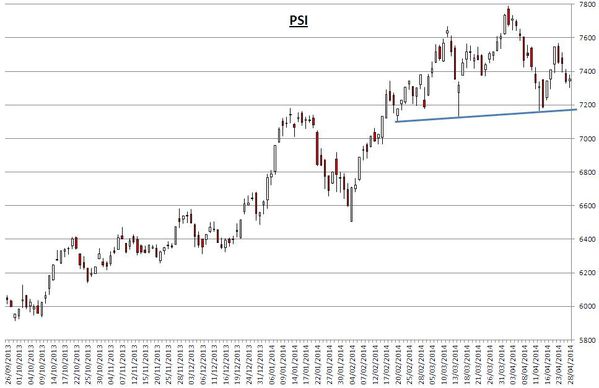
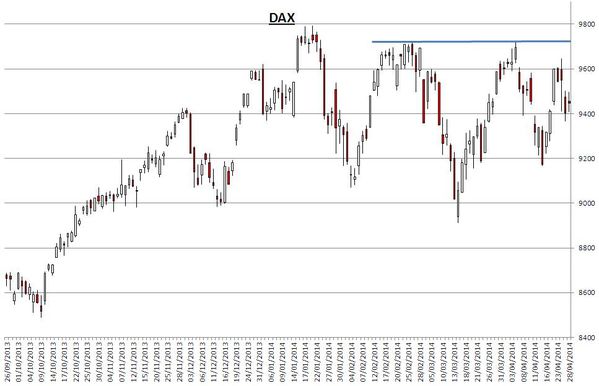
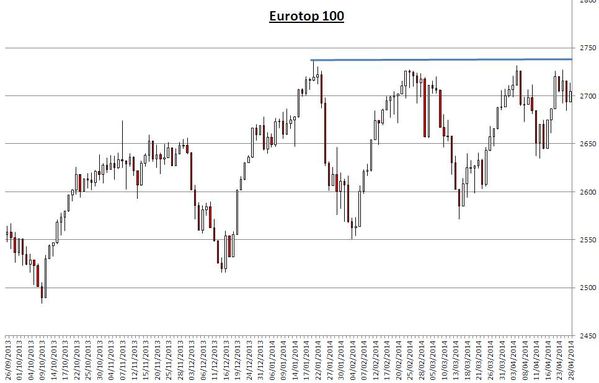
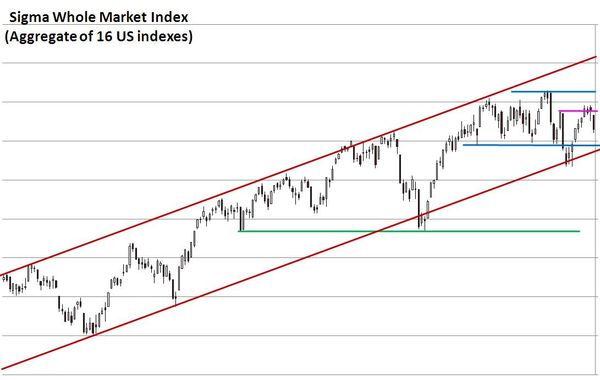
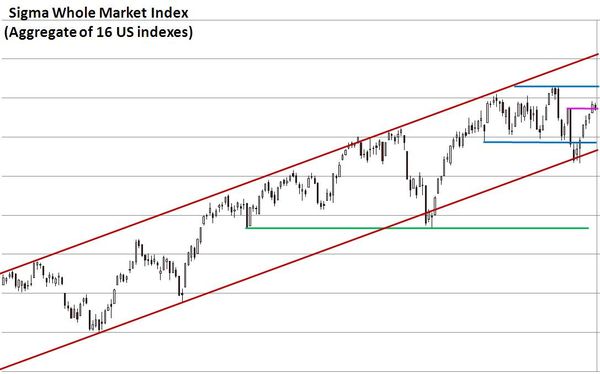
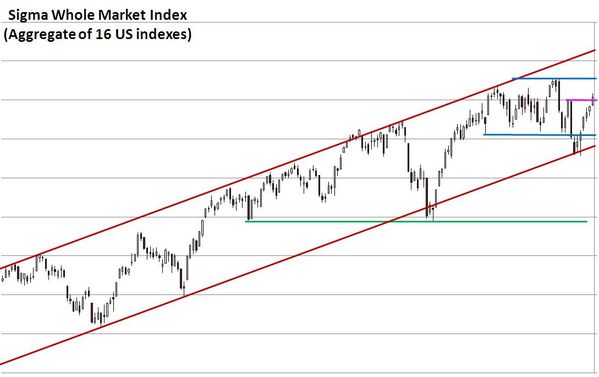
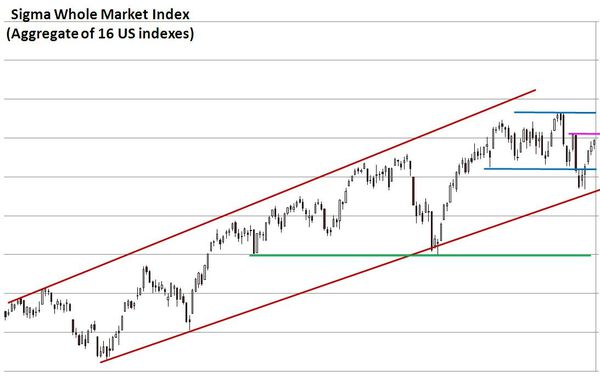
Looking at the chart of the Sigma Whole Market Index we can notice the market remains in its trading range, there is no new information; we need to wait for the breakout in order to get an indication on the next move. Nevertheless, it becomes very difficult for equities to move above recent highs and this is more a sign of weakness rather than a sign of strength.
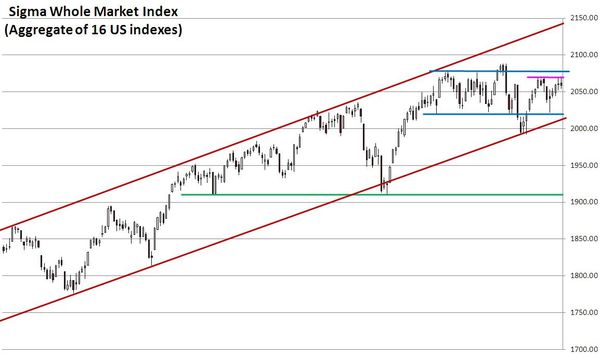
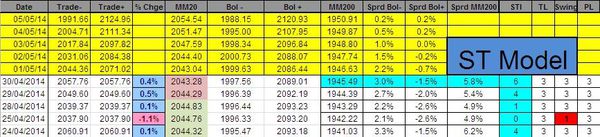
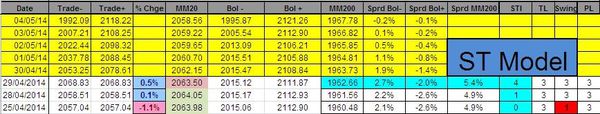
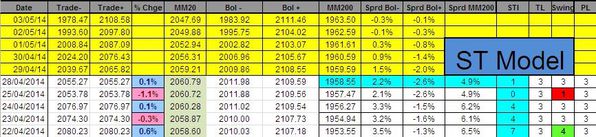
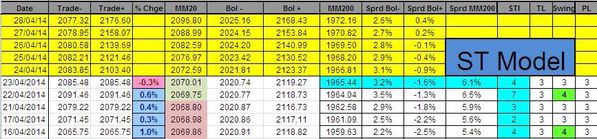
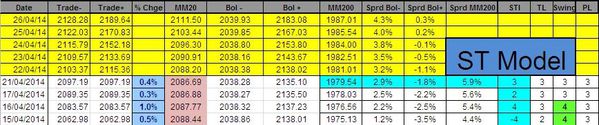
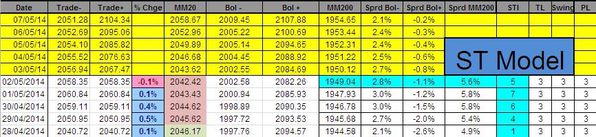
Looking at our indicators, the Sigma Trend Index remains close to its zero line and other index remains neutral at '3'.
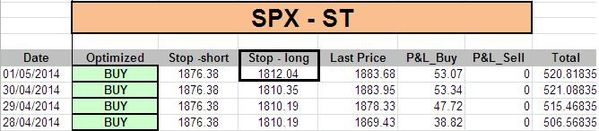
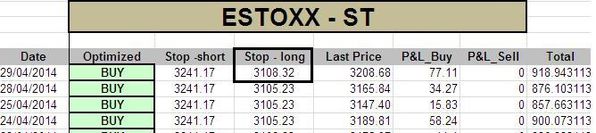
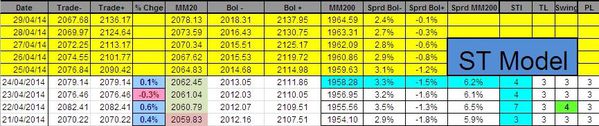
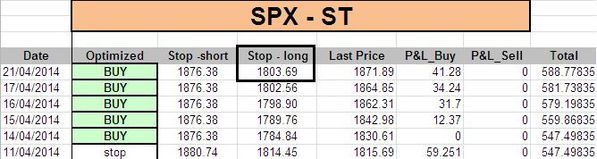
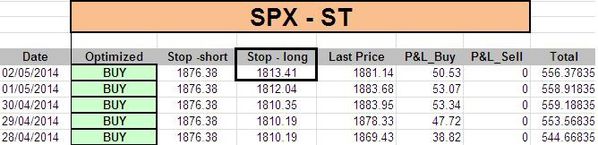
The ST model uplifted its stop on the SPX:
There is no change in our trading book at this stage:
Short Term Trading Book:
- SPX: long at 1830.28 (stop @ 1810, 3pts below the ST model to take into account bid/ask spread)
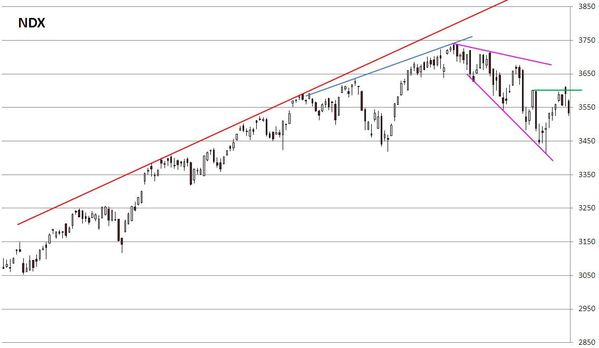
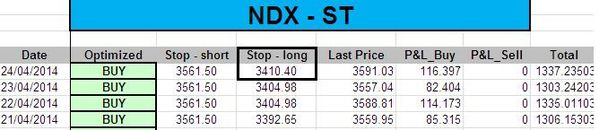
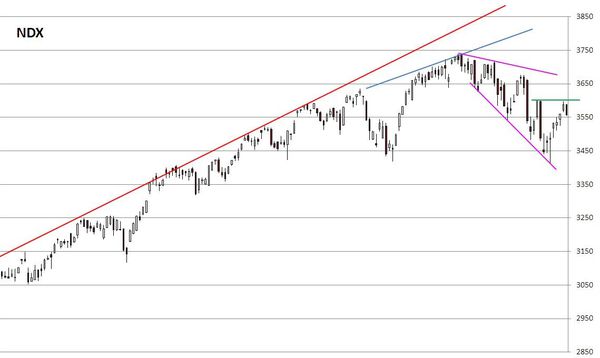
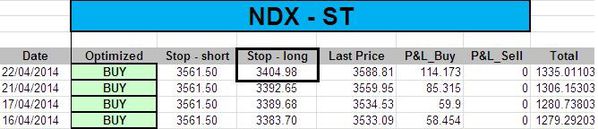
- NDX: long at 3477.72(stop @ 3405, 5pts below the ST model to take into account bid/ask spread)
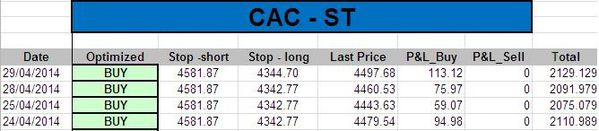
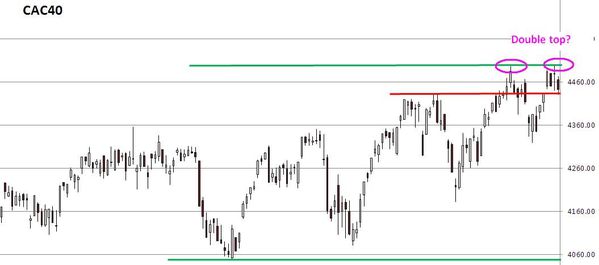
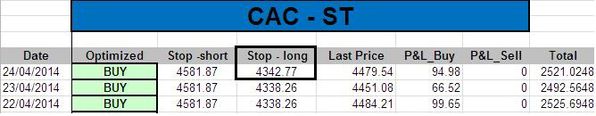
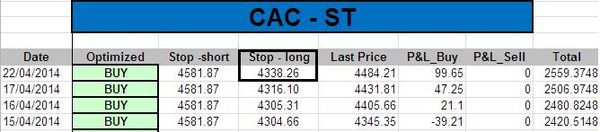
- CAC: long at 4374.06(stop @ 4340, 5pts below the ST model to take into account bid/ask spread)
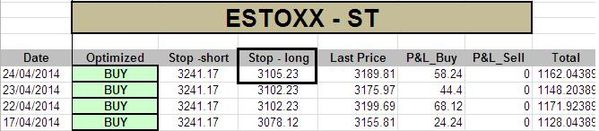
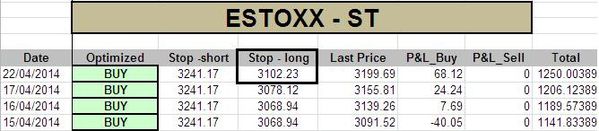
- EStoxx: long at 3115.67 (stop @ 3103, 5pts below the ST model to take into account bid/ask spread)
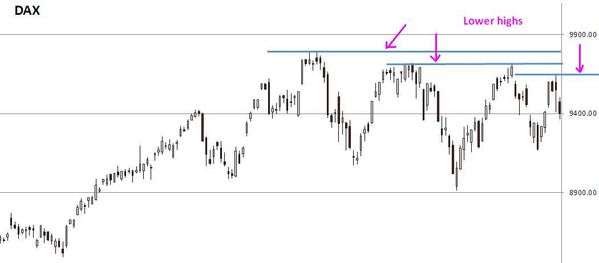
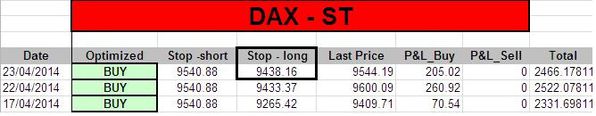
- DAX: stopped
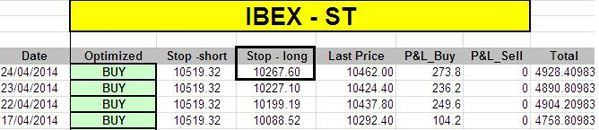
- IBEX: stopped
Medium Term Trading Book:
- No more medium term position at this stage.
Out of model position:
- 1 put SPX, MAY, strike 1400 @ usd2.85
- 2 short NDX @ 3487.38