


The Sigma Whole Europe Index was under pressure on Friday but thanks to 'new developments' in the Greek story (at the end of the session) the market was able to erase its losses and to close roughly flat.
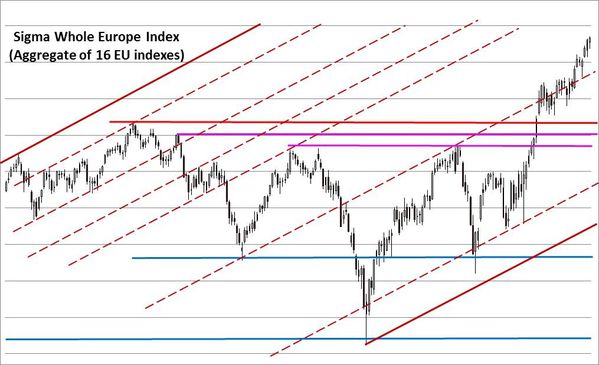
The market remains in its blow off mood, and there is no sign of reversal on the charts. How far can it go?


The Power Level (PL) came in at '2' on Friday. So, the ST model generated a sell signal on European markets.

So, we opened short positions on European indexes during 'extended' hours. We sold:
- 1 CAC @ 4852.47
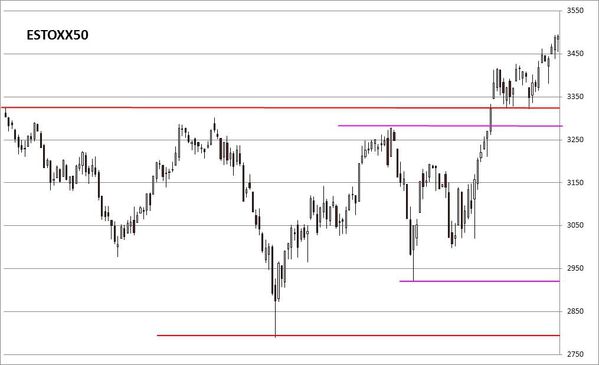
- 1 EStoxx @ 3511.63
- 1 DAX @ 11101.5
- 1 IBEX @ 11006.8
The Sigma Whole Market Index remains in rally mood and it was able to move above its strong horizontal resistance. It seems nothing can stop this market. We are probably in a blow off top process but it is always difficult to have the right timing for the top. The market could continue to rally for a couple of weeks/months (like in 1999- early 2000).

Looking at key indexes, we can notice some divergences between indexes.


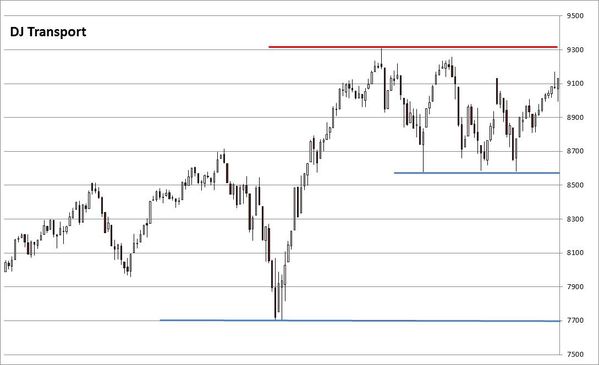
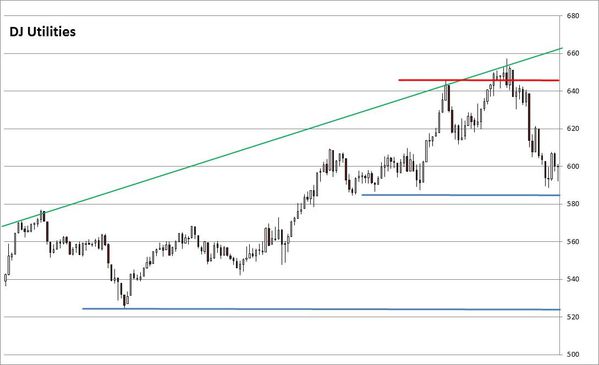
But the DJT and the DJU didn't confirm the new top. So, let's focus on those indexes.
The Sigma Trend Index came in at '18' and the swing came in at '4', telling us the move was impulsive.

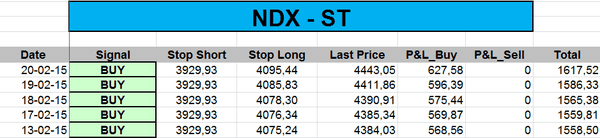
The ST model uplifted its stop on the NDX:
Daily Trading Book:


