Overblog
Suivre ce blog Administration + Créer mon blog
29 janvier 2015 4 29 /01 /janvier /2015 08:01
Europe:

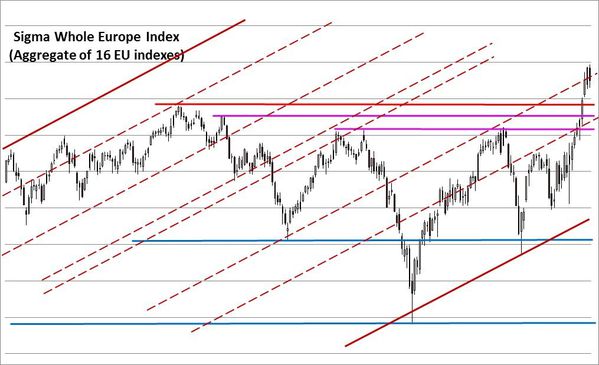
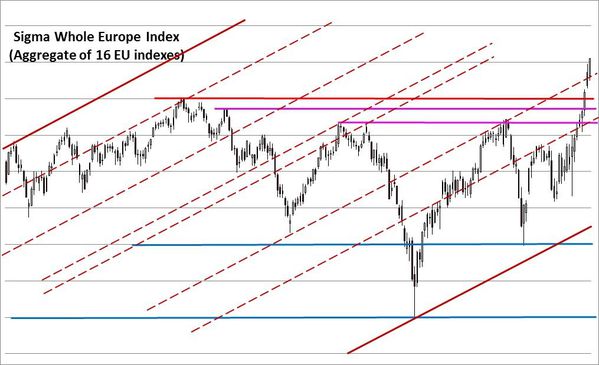
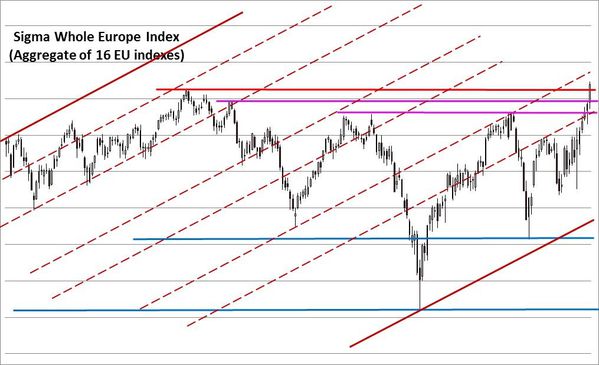
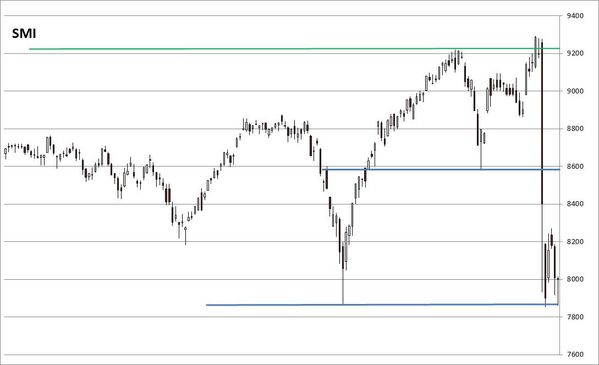
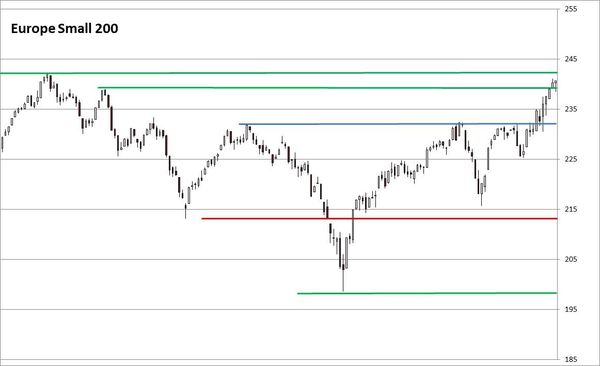
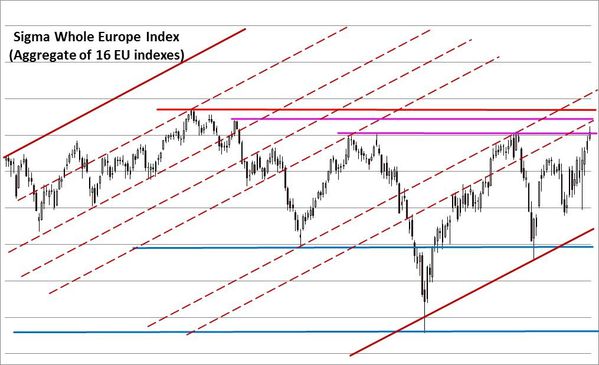
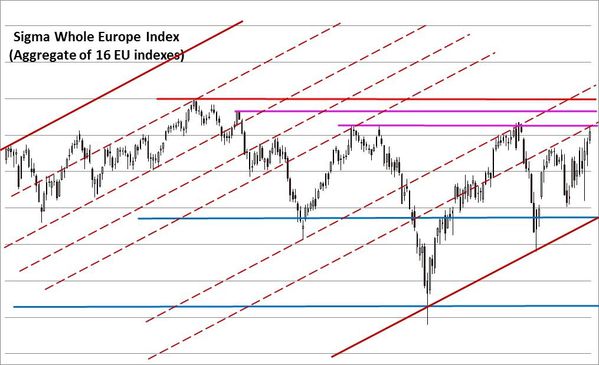
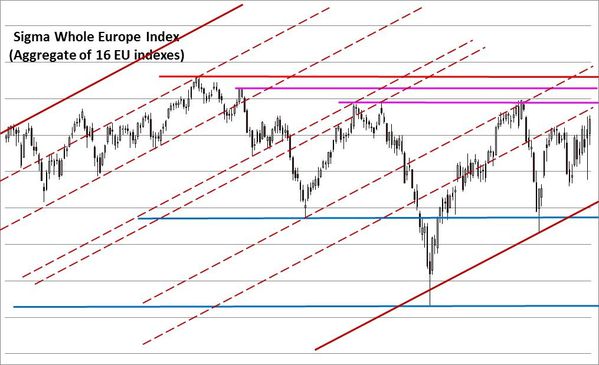
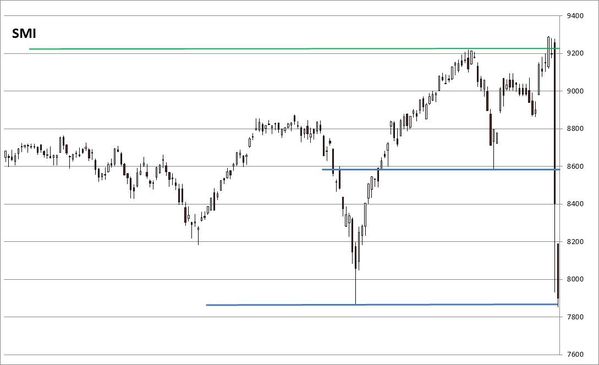
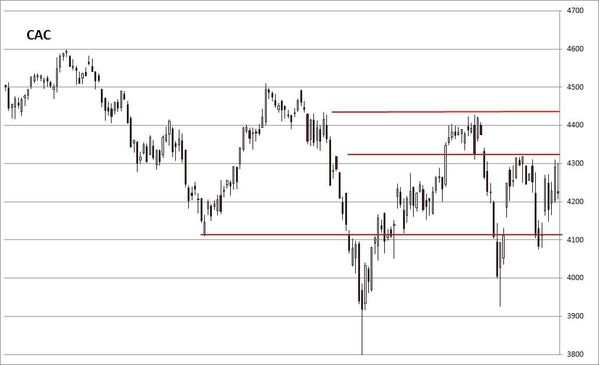
The Sigma Whole Europe Index continues its pull back but we consider there is no real danger at this time. No danger, as long as the market is able to remain above the red horizontal resistance. If the market declines below this strong horizontal support, recent breakup would look like a false break.


EU-Daily-Chart_SWEU_20150129.jpg


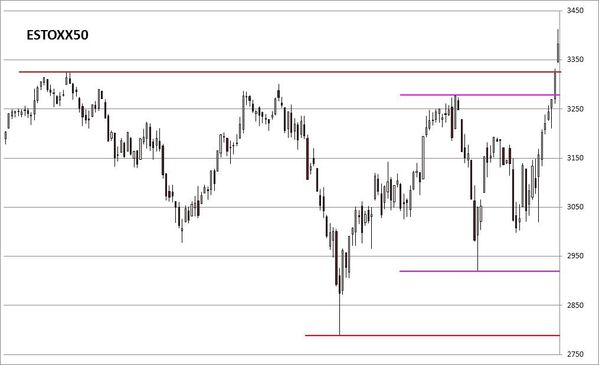
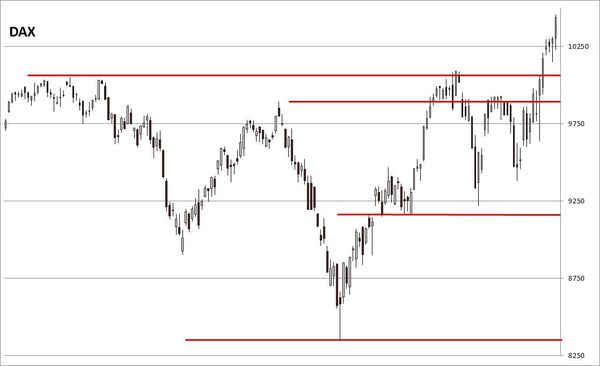
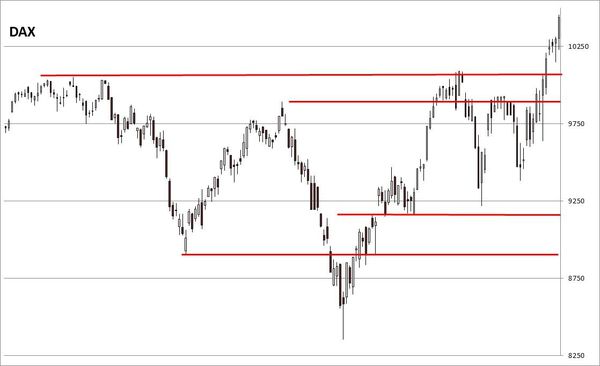
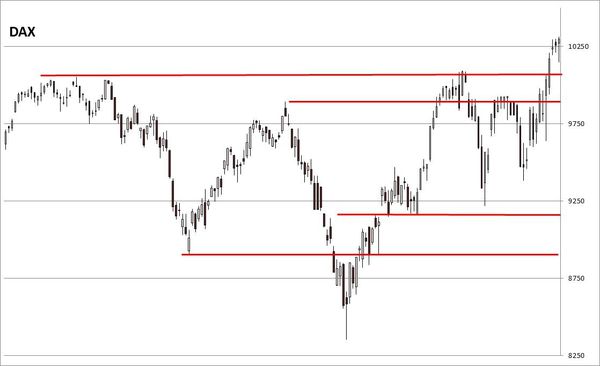
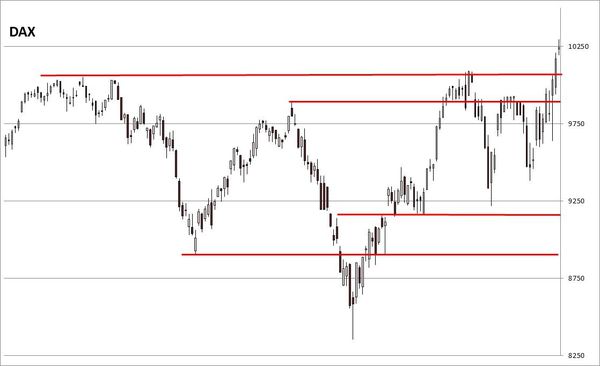
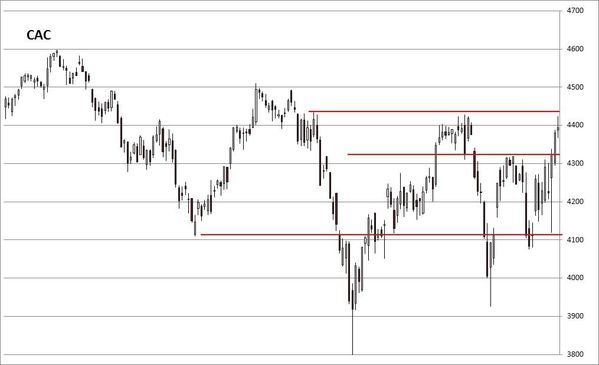
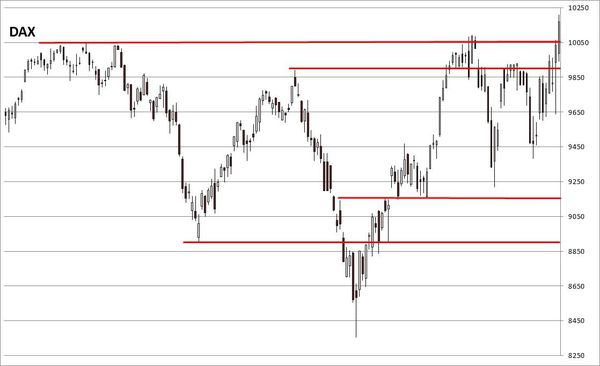
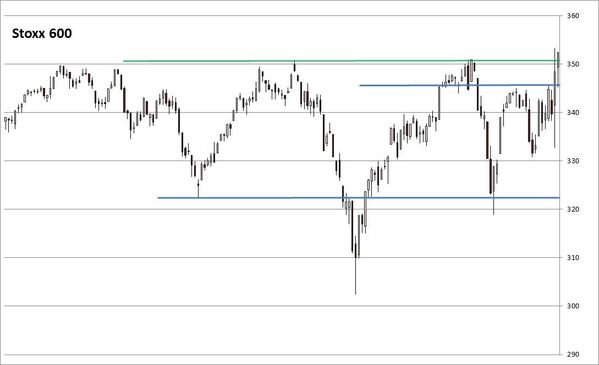
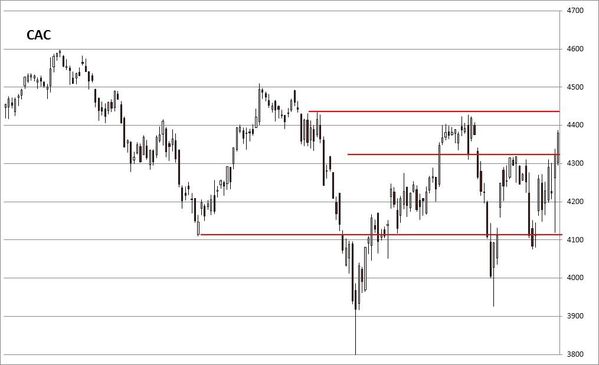
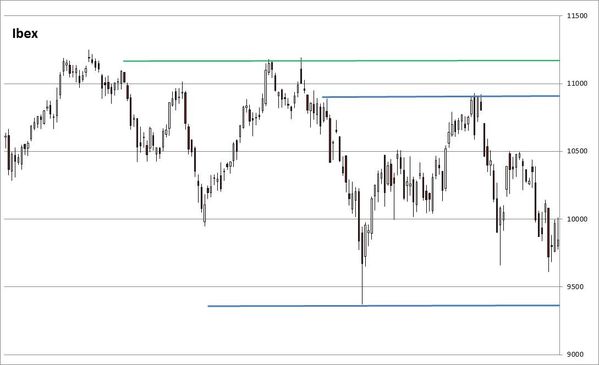
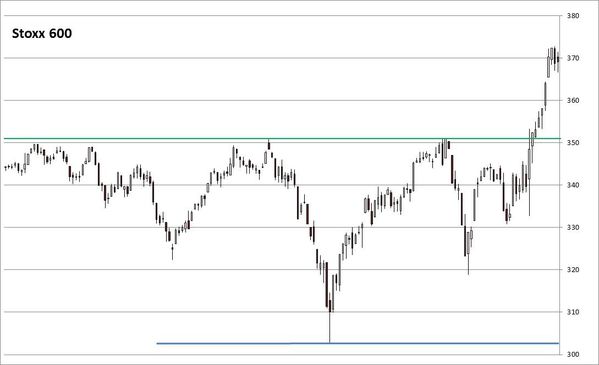
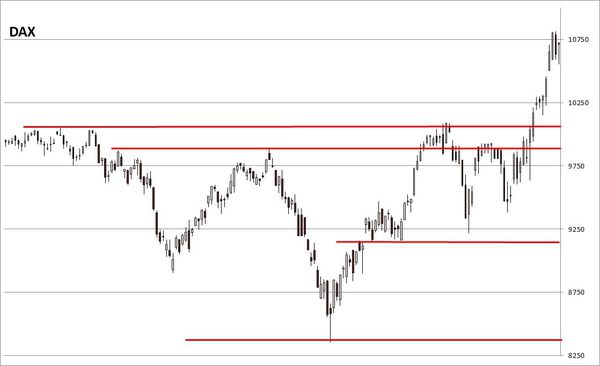
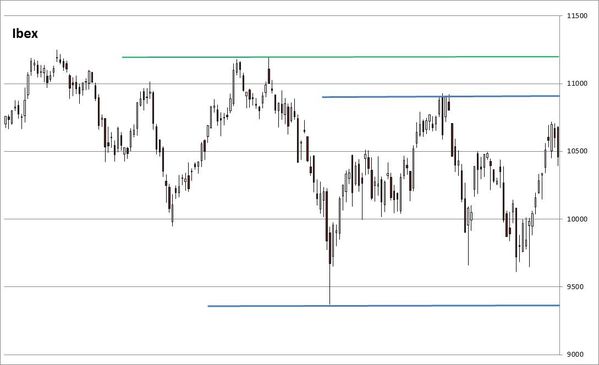
Looking at key European indexes, it is interesting to notice that while the DAX, EuroStoxx 50, Stoxx600, CAC, .... reached new highs in recent session, the IBEX, PSI, .... remain well below their 52 weeks highs. This means that tension between core Europe and periphery are not easing. So, I don't believe that the market is 'really' convinced by the outcome of the EU QE.


EU-Daily-ChartSTOXX600_20150129.jpg

EU-Daily-ChartDAX_20150129.jpg

EU-Daily-ChartIBEX_20150129.jpg


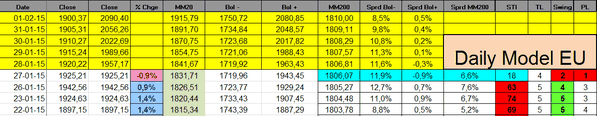
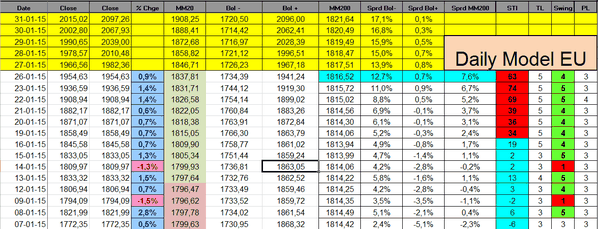
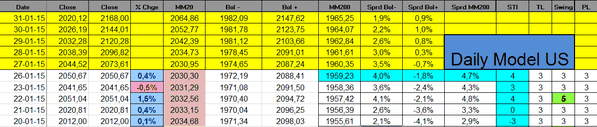
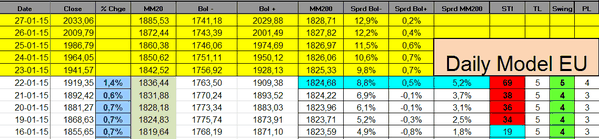
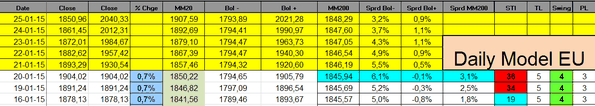
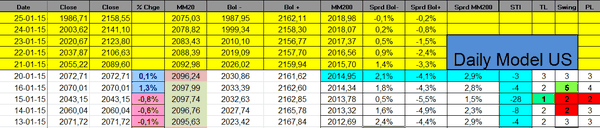
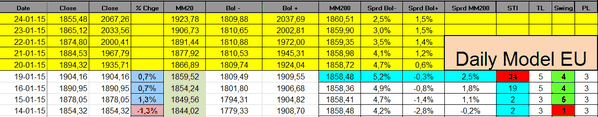
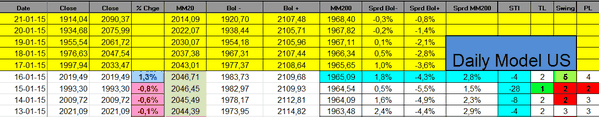
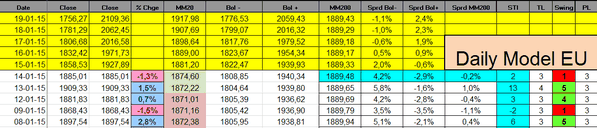
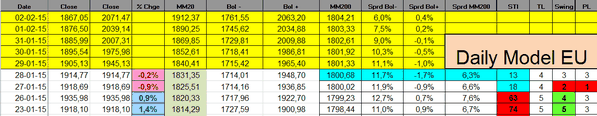
The Sigma Trend Index sharply declined in the last two sessions: from '63' to '13'. Both the Swing and the Power Level were neutral at '3'.


steumodel20150128.PNG


United States:

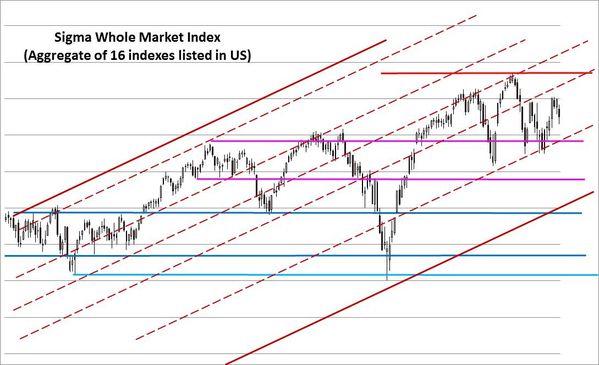
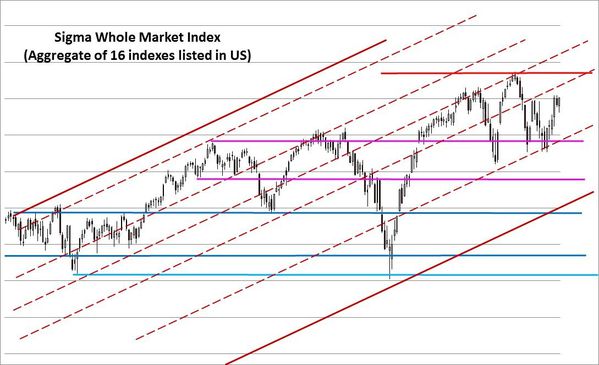
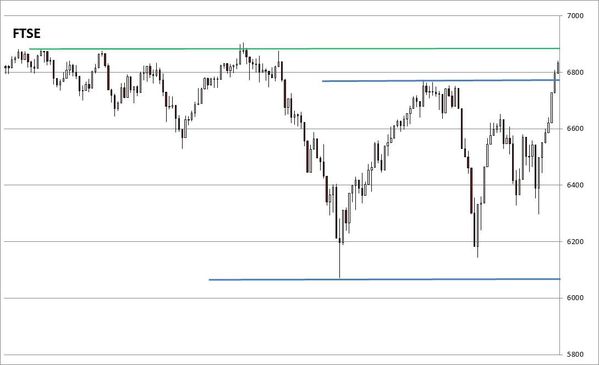
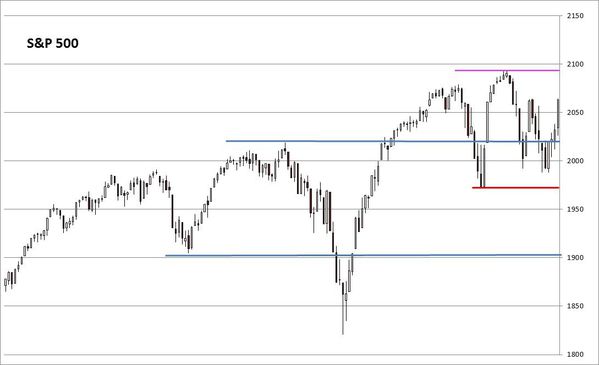
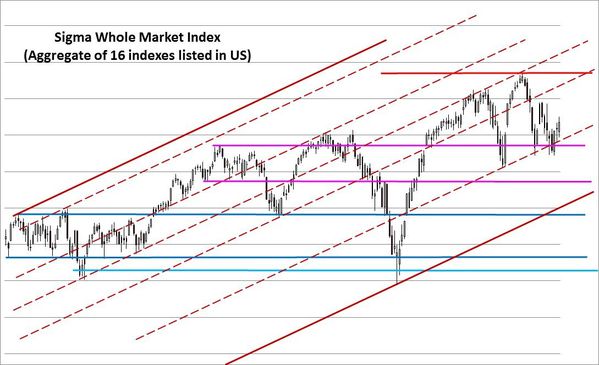
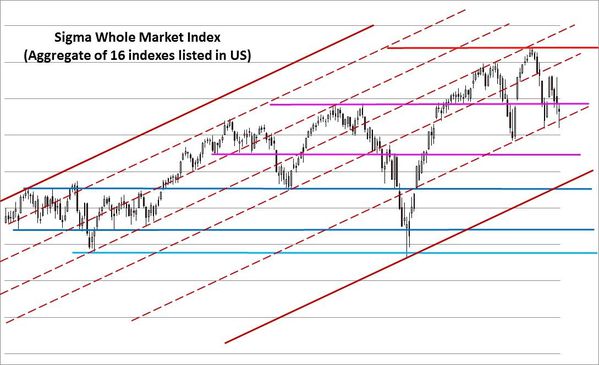
The Sigma Whole Market Index was under pressure on Wednesday. The index is now testing an important ascending trend line. If the market can't hold on this level, there is a major risk of acceleration to the downside.


US-Daily-Chart SWM 20150129


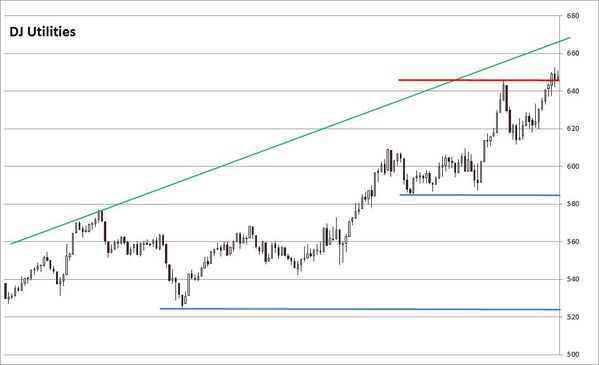
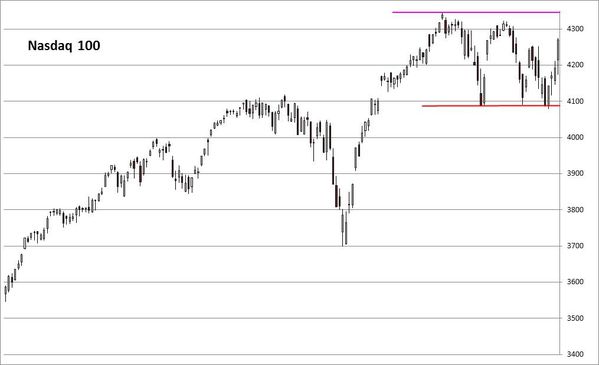
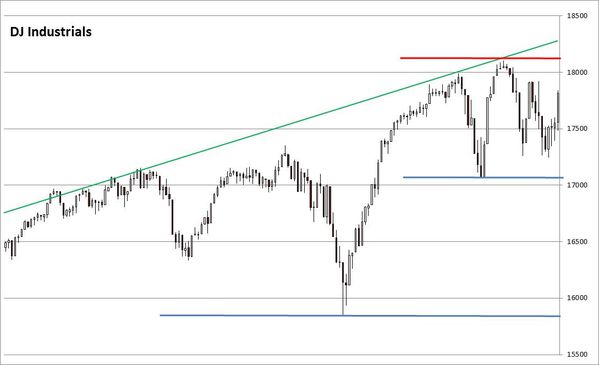
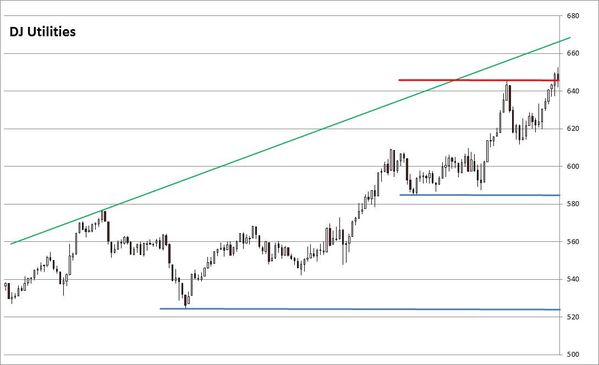
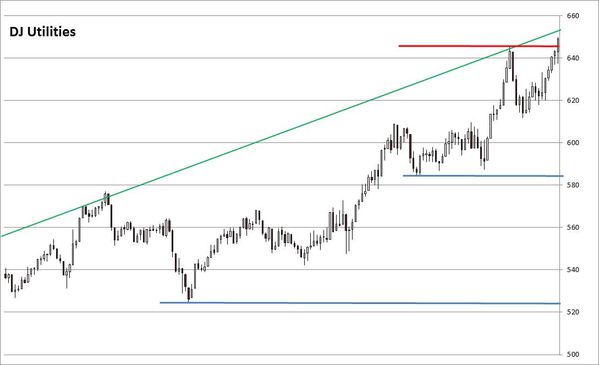
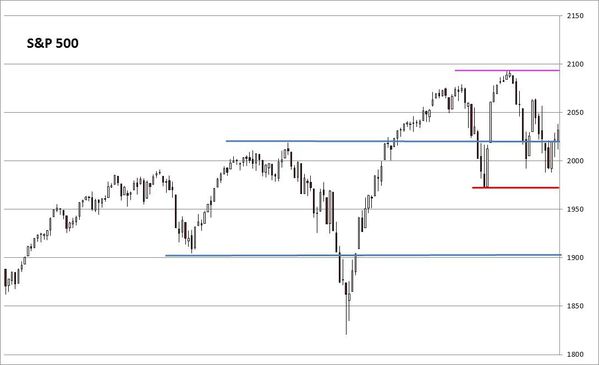
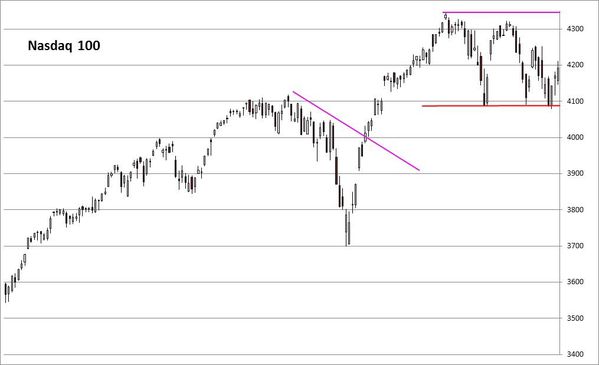
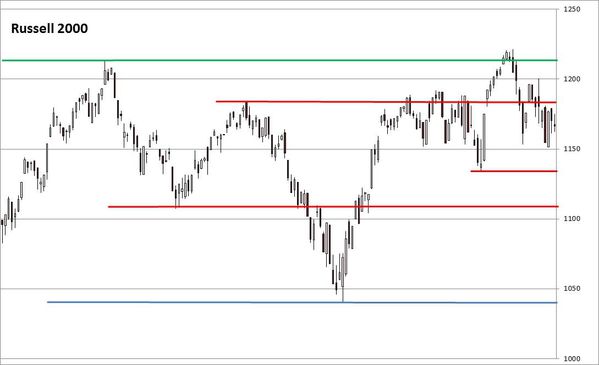
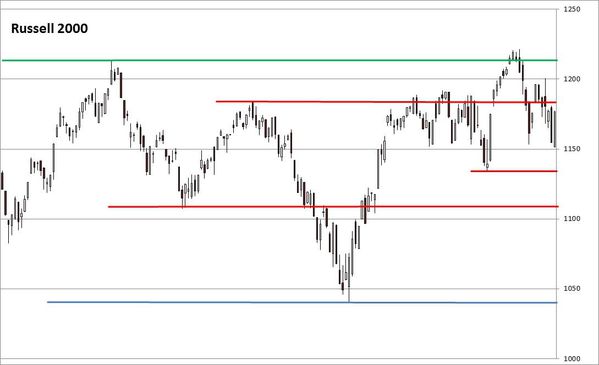
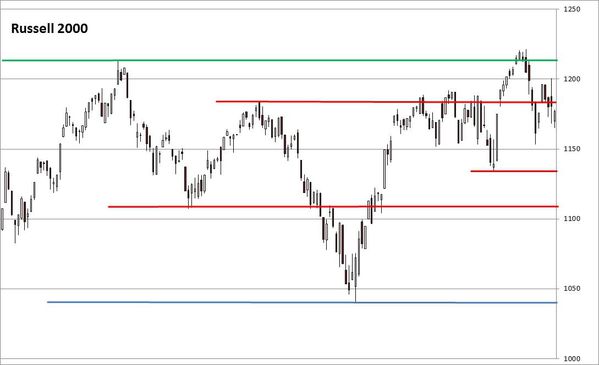
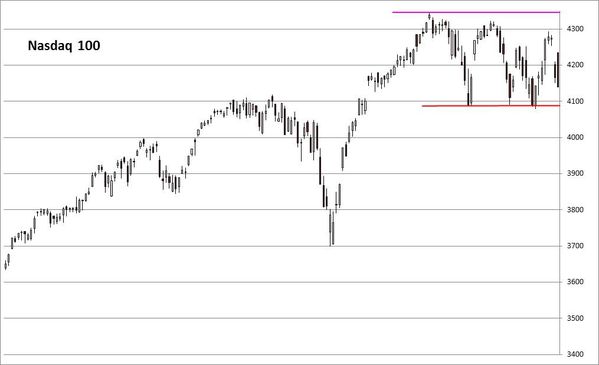
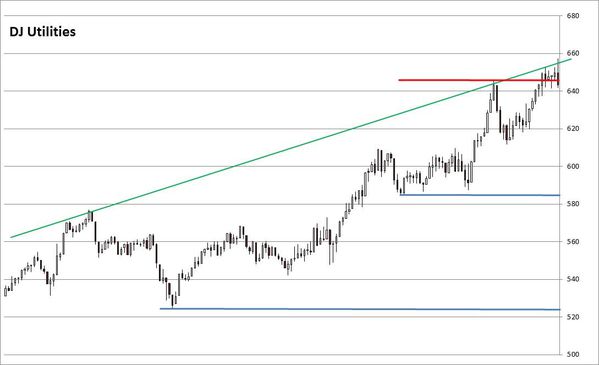
Looking at key US indexes, we can notice that most market leaders of this bull market (NDX, RUT) are now in the middle of their trading range. The new leaders are the dividend stocks: DJ Utilities. But even the DJU is now facing some strong resistance.


US-Daily-ChartRUT_20150129.jpg

US-Daily-ChartNDX_20150129.jpg

US-Daily-ChartDJU_20150129.jpg


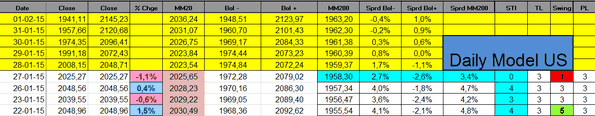
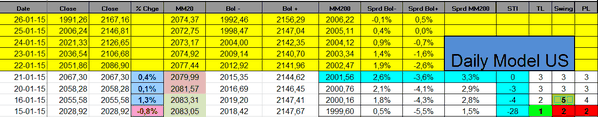
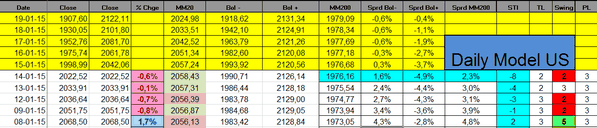
The Sigma Trend Index declined in negative territory. This is negative for the market because it is rolling back in negative territory after a first decline, a bounce back and a consolidation phase. So, current decline looks like a clean move, a new direction for the market.
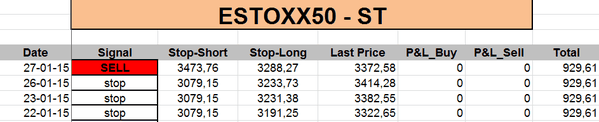
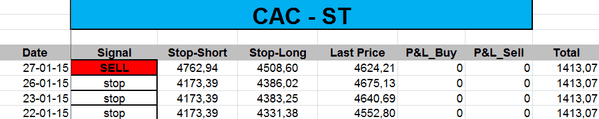
 

stmodel20150128.PNG


Daily Trading Book: 

- SPX: stopped
- NDX: long at 4236.28 (2014's close) (stop @ 4035, 5pts below the ST model to take into account bid/ask spread)
- CAC: short at 4659.35 (stop @ 4763, 5pts above the ST model to take into account bid/ask spread)
- EuroStoxx50: short at 3392.5 (stop @ 3469, 5pts above the ST model to take into account bid/ask spread)
- DAX: short at 10699.75 (stop @ 10938, 10pts above the ST model to take into account bid/ask spread)
- IBEX: short at 10677.7 (stop @ 10861, 10pts above the ST model to take into account bid/ask spread)


Side bet: 

- CAC: short at 4490.35
- EuroStoxx50: short at 3276.5
Partager cet article
Repost0
28 janvier 2015 3 28 /01 /janvier /2015 08:15
Europe:

The Sigma Whole Europe Index had a negative session on Tuesday. Nevertheless, as long as it remains above the red horizontal resistance, we can consider this as a normal consolidation after the huge run up of the 16 latest sessions (14up vs 2 down).


EU-Daily-Chart_SWEU_20150127-copie-1.jpg


Looking at our indicators, the Sigma Trend Index slightly declined and both the Swing and the Power Level (PL) declined below 3 => The ST model generated a 'sell' signal on Europe.


steumodel20150127.PNG


stestoxx20150127.PNG

stcac20150127.PNG

stdax20150127.PNG

stibex20150127.PNG


As we were busy with customers yesterday, we opened our short positions this morning and we sold:


- 1 CAC @ 4659.35

- 1 DAX @ 10699.75

- 1 EUStoxx @ 3392.5

- still waiting for the opening of the IBEX's CFD


United States:

The Sigma Whole Market Index was under heavy selling pressure following in line results but very bad guidance from both Microsoft and Caterpillar. Nevertheless, with the strong results from AAPL and YHOO (in after hours), US futures are jumping tonight and it will be very interesting to monitor if the gap at the open can resist to selling pressure or if it is closed during the first hours of the session.

Don't forget we have the FOMC on Wednesday and we continue to believe that J. Yellen will underline the strong usd and its possible implications on the US economy. By doing so, she will postpone rate hikes expectations. We believe it will have no rate hike in 2015. (we know this is not the consensus but this is our personal view).


US-Daily-Chart SWM 20150127-copie-1


The Sigma Trend Index is testing its zero line. The Swing came in at '1' and tells us the decline was highly impulsive.


stmodel20150127.PNG


Daily Trading Book: 

- SPX: stopped
- NDX: long at 4236.28 (2014's close) (stop @ 4035, 5pts below the ST model to take into account bid/ask spread)
- CAC: short at 4659.35 (stop @ 4768, 5pts above the ST model to take into account bid/ask spread)
- EuroStoxx50: short at 3392.5 (stop @ 3479, 5pts above the ST model to take into account bid/ask spread)
- DAX: short at 10699.75 (stop @ 10927, 10pts above the ST model to take into account bid/ask spread)
- IBEX:waiting for the open of the CFD


Side bet: 

- CAC: short at 4490.35
- EuroStoxx50: short at 3276.5


Partager cet article
Repost0
27 janvier 2015 2 27 /01 /janvier /2015 06:34
Europe:

The Sigma Whole Europe Index continues to climb, this market seems unstoppable. It seems Mr Draghi is THE master of short squeezes.


EU-Daily-Chart_SWEU_20150127.jpg


Looking at our indicators, the Sigma Trend Index remains above the key '34' level and so, it remains ready to generate a 'sell' signal. This is the 6th consecutive session with the STI above the key '34'level, the market booked 8 consecutive sessions of gains (+8% on this period). This kind of move is just unbelievable.

It is nearly sure the ST model will generate a 'sell' signal during this week, but looking at recent strength in the European market, we are not sure this signal will be a good one. Nevertheless, we will implement it when it occurs.


steumodel20150126.PNG


United States:

The Sigma Whole Market Index remains in the middle of its recent trading range. Maybe the market is waiting for J. Yellen. No doubt she could again surprise the market with another dovish statement.


US-Daily-Chart SWM 20150127


The Russell 2000 shows some sign of strength, this is good news for the broad market.


US-Daily-ChartRUT_20150127.jpg


But the Nasdaq 100 remains unconvincing. So, let's wait for the FOMC meeting.


US-Daily-ChartNDX_20150127.jpg


The Sigma Trend Index remains close to its zero line. It seems US market starts to feel the pain of the strong USD. This is a very good reason for J. Yellen to be dovish.


stmodel20150126.PNG


Daily Trading Book: 

- SPX: stopped
- NDX: long at 4236.28 (2014's close) (stop @ 4035, 5pts below the ST model to take into account bid/ask spread)
- CAC: stopped
- EuroStoxx50: stopped
- DAX:  stopped
- IBEX: stopped


Side bet: 

- CAC: short at 4490.35
- EuroStoxx50: short at 3276.5


Partager cet article
Repost0
26 janvier 2015 1 26 /01 /janvier /2015 08:46
Europe:

The Sigma Whole Europe Index continued its rally on Friday. Current move is impressive. We believe we should get a consolidation in coming sessions in order to retest the red horizontal resistance. If the market can remain above the red horizontal resistance, a new upleg is possible.


EU-Daily-Chart_SWEU_20150126.jpg


Looking at key European Indexes, we can notice the Euro zone area is in a bull run while the FTSE and the SMI don't experience the same rally. It is clear that the weaker euro is a strong tailwind for the Eurozone area.


EU-Daily-ChartESTOXX_20150126.jpg

EU-Daily-ChartDAX_20150126.jpg

EU-Daily-ChartCAC_20150126.jpg

EU-Daily-ChartIBEX_20150126.jpg

EU-Daily-ChartSMI_20150126.jpg

EU-Daily-ChartFTSE_20150126.jpg


The Sigma Trend Index came in at '74' and the Swing came in at '5'. The market has been able to book 7 consecutive (positive) impulse session. The market is so overbought (on short term basis) that a 'sell' signal seems unavoidable.


  steumodel20150123.PNG


United States:

The Sigma Whole Market Index was unable to hold its gain on Friday. At the end of the session, the market came under selling pressure. It is clear the strong USD weights on corporate profits and competitiveness. 


US-Daily-Chart_SWM_20150126.jpg


Looking at key US indexes we can notice they are not in the same situation than the European market: most of them are not close to their recent top. The DJ Utilities is the big exception and it is probably due to dividend yield hunting in this weak interest rates environment.


US-Daily-ChartSP500_20150126.jpg

US-Daily-ChartNDX_20150126.jpg

US-Daily-ChartDJI_20150126.jpg

US-Daily-ChartRUT_20150126.jpg

US-Daily-ChartDJU_20150126.jpg


The Sigma Trend Index close the week above its zero line, this is a positive sign for the US equity market..


stmodel20150123.PNG


Daily Trading Book: 

- SPX: stopped
- NDX: long at 4236.28 (2014's close) (stop @ 4035, 5pts below the ST model to take into account bid/ask spread)
- CAC: stopped
- EuroStoxx50: stopped
- DAX:  stopped
- IBEX: stopped


Side bet: 

 CAC: short at 4490.35
- EuroStoxx50: short at 3276.5


Partager cet article
Repost0
23 janvier 2015 5 23 /01 /janvier /2015 10:09
Europe:

Tanks to the ECB, the Sigma Whole Europe Index was able to move and close above the key red horizontal resistance. This looks bullish on a technical basis unless this move is a false break/bull trap. 


EU-Daily-Chart_SWEU_20150122-copie-1.jpg


Looking at key European Indexes, we can notice a clear breakout on some of them.


EU-Daily-ChartSTOXX600_20150122-copie-1.jpg

EU-Daily-ChartDAX_20150122-copie-1.jpg

EU-Daily-ChartESTOXX_20150122.jpg

EU-Daily-ChartCAC_20150122.jpg

EU-Daily-ChartFTSE_20150122-copie-1.jpg


The SMI remains under pressure due to the weakening euro but as long as it remains above the blue horizontal support, things remain under control.


EU-Daily-ChartSMI_20150122.jpg


The Sigma Trend Index jumped to '69'. This level is unsustainable, current upleg is in a full impulse move for the 6 latest sessions. This kind of move is highly powerful. This could be the signal for a major brekout.


steumodel20150122.PNG


United States

The Sigma Whole Market Index enjoyed a strong session on Thursday. Like a junky, the market was feeling good with the new wave of liquidity coming from the ECB.


US-Daily-Chart_SWM_20150123.jpg


Most US indexes are in a bounce back mode, but only few of them are close to their recent top.


US-Daily-ChartSP500_20150123.jpg

US-Daily-ChartRUT_20150123.jpg

US-Daily-ChartNDX_20150123.jpg

US-Daily-ChartDJI_20150123.jpg

US-Daily-ChartDJT_20150123.jpg

US-Daily-ChartDJU_20150123.jpg


The Sigma Trend Index moved in positive territory (at '4'). The Swing came in at '5' telling us the session was highly impulsive.


stmodel20150122.PNG


Daily Trading Book: 

- SPX: stopped
- NDX: long at 4236.28 (2014's close) (stop @ 4035, 5pts below the ST model to take into account bid/ask spread)
- CAC: stopped
- EuroStoxx50: stopped
- DAX:  stopped
- IBEX: stopped


Side bet: 

-   CAC: short at 4490.35
- EuroStoxx50: short at 3276.5


Partager cet article
Repost0
22 janvier 2015 4 22 /01 /janvier /2015 09:33
Europe:

The Sigma Whole Europe Index was able to move above the first pink horizontal resistance. There is a high probability the market could test the red horizontal resistance on the ECB' decision. In order to open the way for further gains, we need a close above the red horizontal resistance.


EU-Daily-Chart_SWEU_20150122.jpg


Looking at key EU indexes, we can see various situations: some indexes are printing new highs while other indexes remain in the middle of their trading range.


EU-Daily-ChartDAX_20150122.jpg

EU-Daily-ChartEUSMALL200_20150122.jpg

EU-Daily-ChartSTOXX600_20150122.jpg

EU-Daily-ChartFTSE_20150122.jpg

EU-Daily-ChartIBEX_20150122.jpg


The Sigma Trend Index Europe remains above the key '34' level. So, any impulse move to the downside in the next 3 sessions will trigger a 'sell' signal. The 5 latest sessions were impulsive, this is rather unusual: either we are at the early stage of a major move or we are in a capitulation situation. But the rally is so extended on a short term basis that we believe a sell on news (after the ECB's decision) is likely.


steumodel20150121.PNG


United States:

The Sigma Whole Market Index remains above a strong horizontal resistance but recent action is not really convincing for a bull run. It seems we could be in a counter trend move.


US-Daily-Chart_SWM_20150122.jpg


Looking at key indexes, we have roughly the same situation than in Europe: some indexes are close to their recent top while others remain in the middle of their recent trading range.


US-Daily-ChartDJU_20150122.jpg

US-Daily-ChartDJI_20150122.jpg

US-Daily-ChartSP500_20150122.jpg

US-Daily-ChartNDX_20150122.jpg

US-Daily-ChartRUT_20150122.jpg


The Sigma Trend Index is testing its zero line. So, US markets are not out of the wood, recent action could have been a technical rebound.


stmodel20150121.PNG


Daily Trading Book: 

- SPX: stopped
- NDX: long at 4236.28 (2014's close) (stop @ 4035, 5pts below the ST model to take into account bid/ask spread)
- CAC: stopped
- EuroStoxx50: stopped
- DAX:  stopped
- IBEX: stopped


Partager cet article
Repost0
21 janvier 2015 3 21 /01 /janvier /2015 09:33
Europe:

The Sigma Whole Europe Index continues to rally: everyone is buying like crazy before the ECB meeting. I wouldn't be surprised if we get a sell on the news this Thursday.  It is important to notice the market is unable to close above the pink horizontal resistance.


EU-Daily-Chart_SWEU_20150121.jpg


The Sigma Trend Index closed above the key '34' level for the second consecutive session.  So, we will see if the ST model can generate a sell signal within the next 3 sessions.


steumodel20150120.PNG


United States:

The Sigma Whole Market Index remains very resilient: there is no sign of weakness at this stage.


US-Daily-Chart_SWM_20150121.jpg


The Sigma Trend Indexremains in negative territory and is very close to its zero line. It seems the US markets are also waiting for the ECB.


stmodel20150120.PNG


Daily Trading Book: 

- SPX: stopped
- NDX: long at 4236.28 (2014's close) (stop @ 4035, 5pts below the ST model to take into account bid/ask spread)
- CAC: stopped
- EuroStoxx50: stopped
- DAX:  stopped
- IBEX: stopped


Partager cet article
Repost0
20 janvier 2015 2 20 /01 /janvier /2015 07:42
Europe:

The Sigma Whole Europe Index enjoyed another strong session on Monday and it is now right below a major resistance. If the market can move above this level, this will be a very good sign for the market.


EU-Daily-Chart_SWEU_20150120.jpg


Looking at major European indexes, we can see the DAX is in record territory while the CAC and the Small200 are right below major resistance.


EU-Daily-ChartDAX_20150120.jpg

EU-Daily-ChartEUSMALL200_20150120.jpg

EU-Daily-ChartCAC_20150120.jpg


The SMI remains above its strong support area.


EU-Daily-ChartSMI_20150120.jpg


The Sigma Trend Index reached the key '34' level. So, if the Swing and/or the Power Level decline at (or below) '2' in the next 3 sessions, the ST model will trigger a Sell signal.


steumodel20150119.PNG


Daily Trading Book: 

- SPX: stopped
- NDX: long at 4236.28 (2014's close) (stop @ 4035, 5pts below the ST model to take into account bid/ask spread)
- CAC: stopped
- EuroStoxx50: stopped
- DAX:  stopped
- IBEX: stopped
Partager cet article
Repost0
19 janvier 2015 1 19 /01 /janvier /2015 07:48
Europe:

Thanks to another round of QE anticipation, the Sigma Whole Europe Index enjoyed a strong session on Friday. It is now close to a strong horizontal resistance. Let's see if it is able to print a mid term higher high or if it fails again.


EU-Daily-Chart_SWEU_20150119.jpg


Looking at major EU indexes, we can notice that some of them were able to print new highs at the end of last week.


EU-Daily-ChartDAX_20150119.jpg

EU-Daily-ChartSTOXX600_20150119.jpg

EU-Daily-ChartCAC_20150119.jpg


Following SNB's decision, the SMI sharply declined last week but it was able to find some support on Friday.


EU-Daily-ChartSMI_20150119.jpg


The Sigma Trend Index increased to '19, we are not very far from the key '34' level. It will be interesting to monitor if we can reach this level by Wednesday.


steumodel20150116.PNG


United States:

The Sigma Whole Market Index was able to bounce back above the pink horizontal line. This is positive. Nevertheless, recent action has been highly volatile and we need to remain cautious.


US-Daily-Chart_SWM_20150119.jpg


Looking at key US indexes, all of them enjoyed a strong end of the week. Both the DJ Transport and the Nasdaq100 are very close to a major support while the DJ Utilities is close to print new highs.


US-Daily-ChartRUT_20150119.jpg

US-Daily-ChartNDX_20150119.jpg

US-Daily-ChartSP500_20150119.jpg

US-Daily-ChartDJU_20150119.jpg

US-Daily-ChartDJT_20150119.jpg


The Sigma Trend Index bounced back and is now close to its zero line. The Swing came in at '5', telling us the move was highly impulsive.


stmodel20150116.PNG


- SPX: stopped
- NDX: long at 4236.28 (2014's close) (stop @ 4035, 5pts below the ST model to take into account bid/ask spread)
- CAC: stopped
- EuroStoxx50: stopped
- DAX:  stopped
- IBEX: stopped
Partager cet article
Repost0
15 janvier 2015 4 15 /01 /janvier /2015 09:17
Europe:

The Sigma Whole Europe Index is right below the first pink horizontal resistance. According to futures, the market should be able to test the next horizontal resistance during the session. It will be interesting to monitor what happens around this level.


EU-Daily-Chart_SWEU_20150115.jpg


As the volatility of the European volatility is declining, the market could enjoy a bounce back in coming sessions.


EU-Daily-Chart_Vol_V2X_20150115.jpg


Looking at key EU indexes, we can notice the SMI was not able to remain above its previous top (should be ok today),the FTSE was under heavy selling pressure (due to miners and oil companies)


EU-Daily-ChartSMI_20150115.jpg

EU-Daily-ChartFTSE_20150115.jpg

EU-Daily-ChartSTOXX600_20150115.jpg

EU-Daily-ChartDAX_20150115.jpg

EU-Daily-ChartCAC_20150115.jpg

EU-Daily-ChartIBEX_20150115.jpg


The Sigma Trend Index is close to its zero line. The Swing came in at '1', telling us the decline was highly impulsive.


steumodel20150114.PNG


United States:

The Sigma Whole MArket had a difficult session on Wednesday as it declined below the pink horizontal resistance. Nevertheless, it was able to close well above its intraday low and it rebounded on the red dotted ascending line. So, once again, it is difficult to turn extremely bearish at this stage.


US-Daily-Chart_SWM_20150115.jpg


The Sigma Smart Money Index (SSMI) continues to decline but it hasn't been abe to print any new low in recent sessions. So, all in all, this is not bad.


US-Daily-SSMI_20150115.jpg


Looking at key US indexes, we can notice that the DJ Transport is the most advance in the decline but as it was able to rebound on the December's low, the situation is not so bad. This index is the key one to ficus on in coming sessions


US-Daily-ChartDJT_20150115.jpg

US-Daily-ChartSP500_20150115.jpg

US-Daily-ChartNDX_20150115.jpg

US-Daily-ChartRUT_20150115.jpg


The Sigma Trend Index declined to '-8'. The Swing came in at '2'.


stmodel20150114.PNG


For te second time this year, our position on the SPX was stopped at the intraday low, grrrrrrrr...


- SPX: 1988.67 - 2026.41 = - 37.74 (loss)


stspx20150114.PNG


- SPX: stopped
- NDX: long at 4236.28 (2014's close) (stop @ 4035, 5pts below the ST model to take into account bid/ask spread)
- CAC: stopped
- EuroStoxx50: stopped
- DAX:  stopped
- IBEX: stopped


Partager cet article
Repost0

Presentation

  • : Le blog de sigmatradingoscillator
  • : Professionnel de la finance de marché depuis plus de 10ans, j'ai mis au point une série d'outils de trading me permettant de prendre et couper mes positions. Ici, j'écris un update quotidien sur la situation du CAC,DAX, Eurostoxx, SP500, Nasdaq100. Attention Les éléments repris dans ce blog représentent uniquement mon opinion personnelle et ne constituent en aucun cas une incitation au trading ou du conseil financier. Pour du conseil, consultez votre conseiller en placement
  • Contact

Disclaimer

NO MATERIAL HERE CONSTITUTES "INVESTMENT ADVICE" NOR IS IT A RECOMMENDATION TO BUY OR SELL ANY FINANCIAL INSTRUMENT, INCLUDING BUT NOT LIMITED TO STOCKS, COMMODITIES, OPTIONS, BONDS, FUTURES, OR BULLION. ACTIONS YOU UNDERTAKE AS A CONSEQUENCE OF OUR ANALYSIS, OPINION OR ADVERTISEMENT ON THIS SITE ARE YOUR SOLE RESPONSIBILITY.

FOR INVESTMENT ADVICE, PLAN A MEETING WITH A FINANCIAL ADVISOR IN ORDER TO ESTABLISH YOUR OWN RISK PROFILE.

Archives

Pages