12 février 2015
4
12
/02
/février
/2015
09:25
I'm very busy today with the earnings season. So, the update will be short because there is no major change in the market.
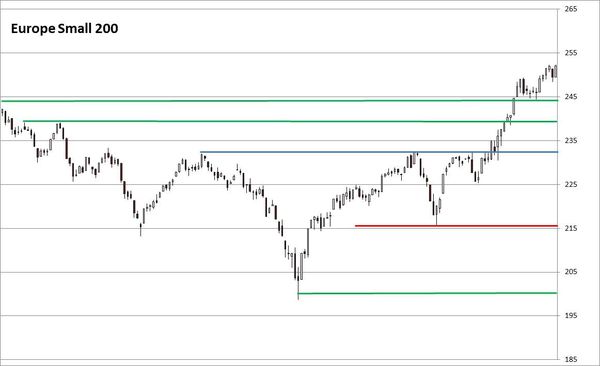
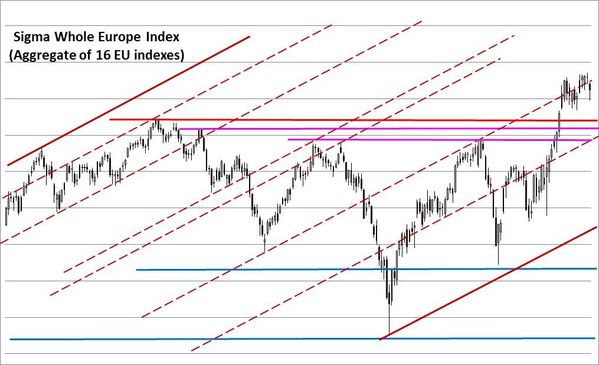
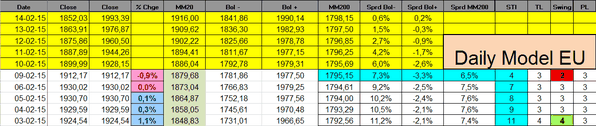
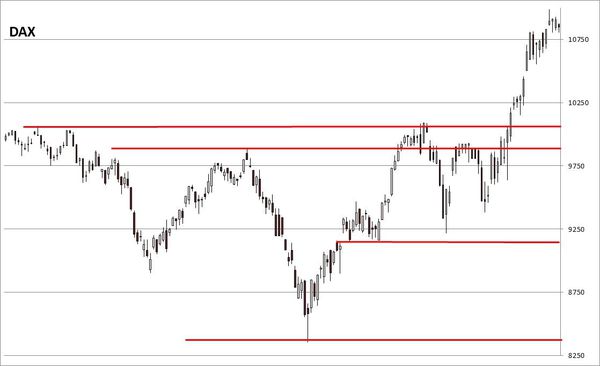
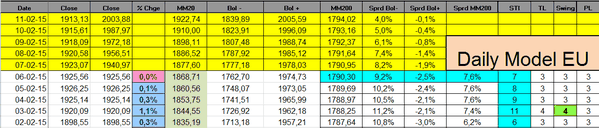
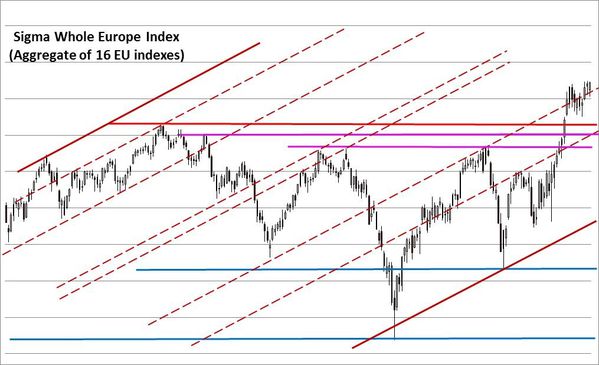
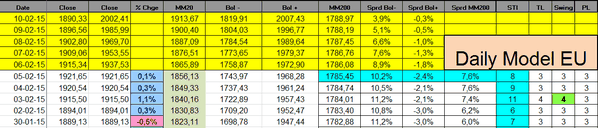
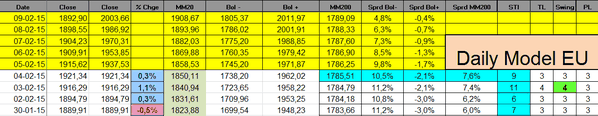
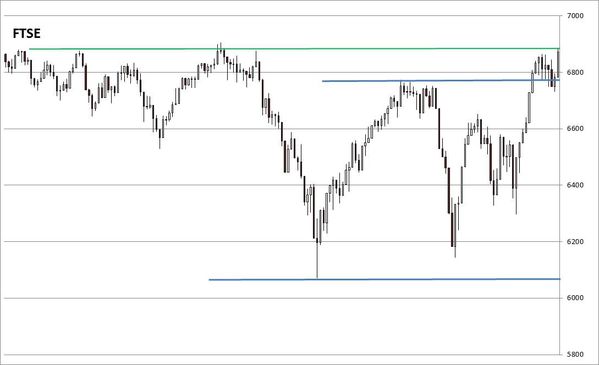
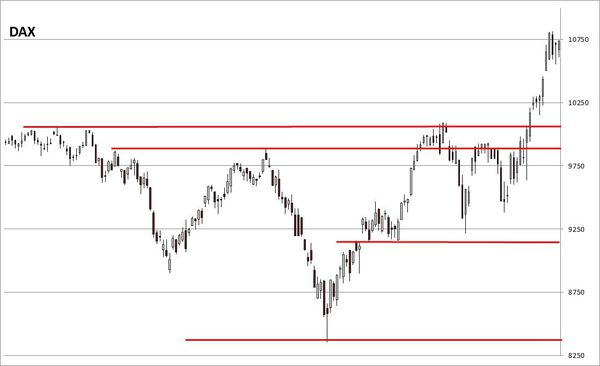
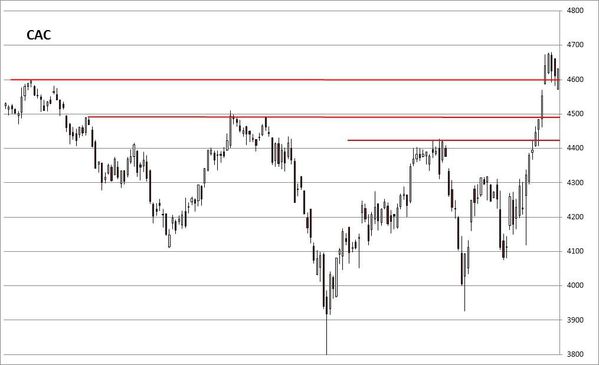
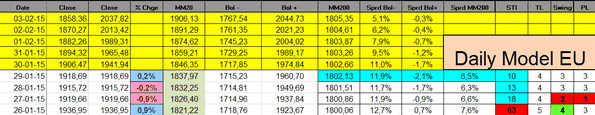
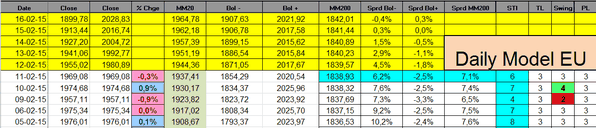
Europe:
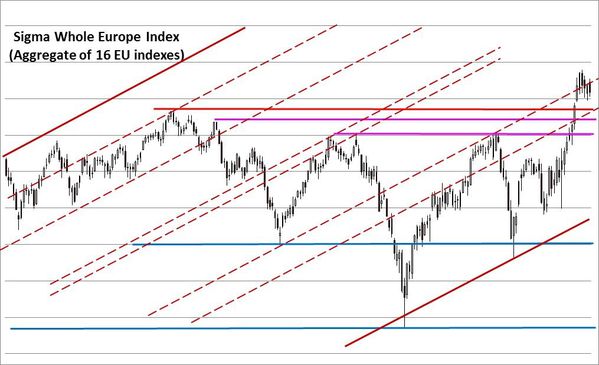
The Sigma Whole Europe Index continues its consolidation at elevated levels. The market remains in wait and see mood, hoping for the best in both Ukrainian and Greek negotiations.

The Sigma Trend Index remains above its zero line and other indicators are neutral.
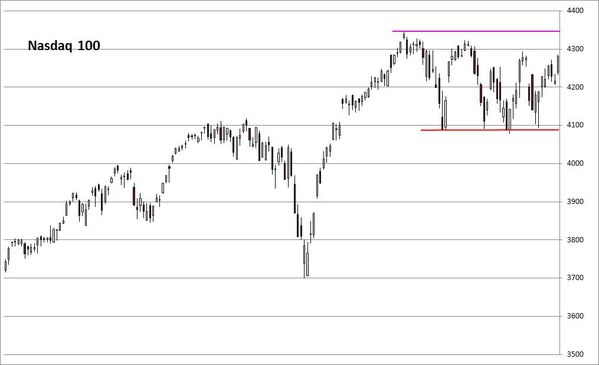
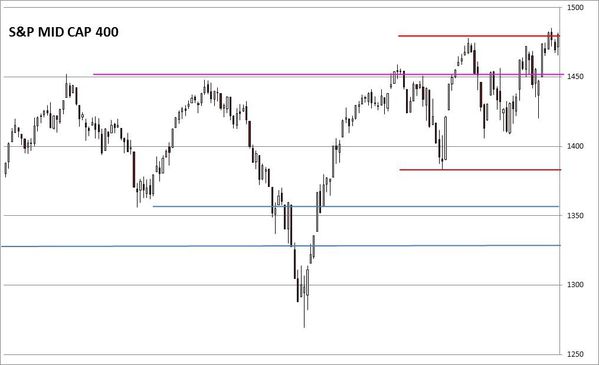
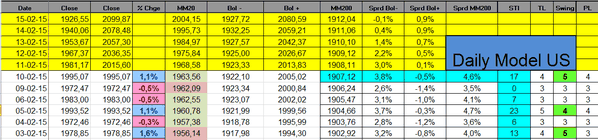
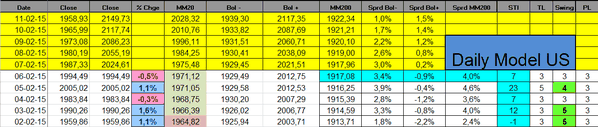
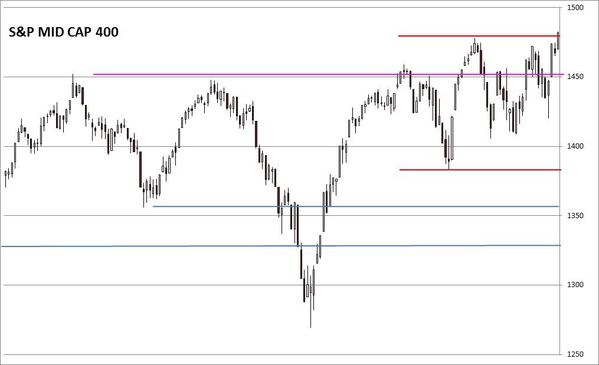
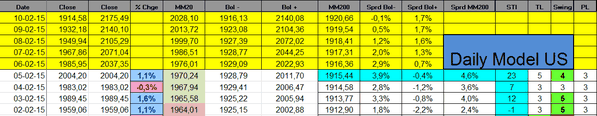
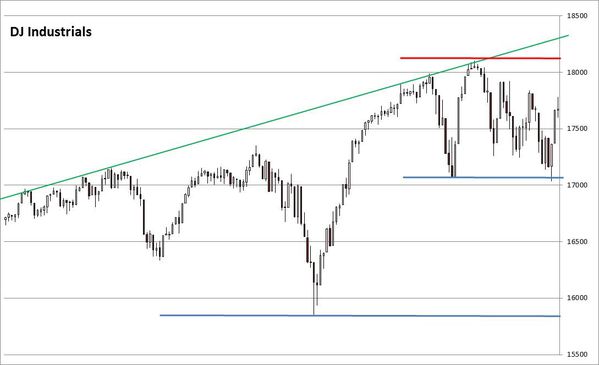
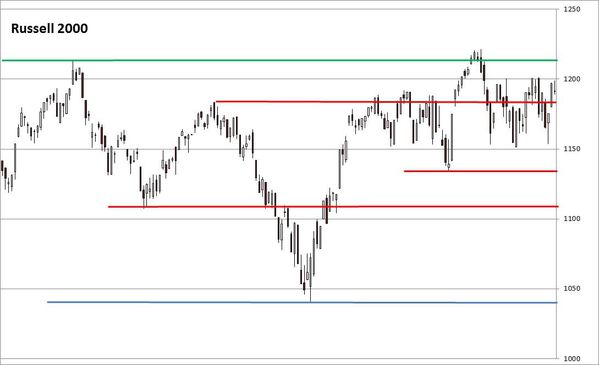
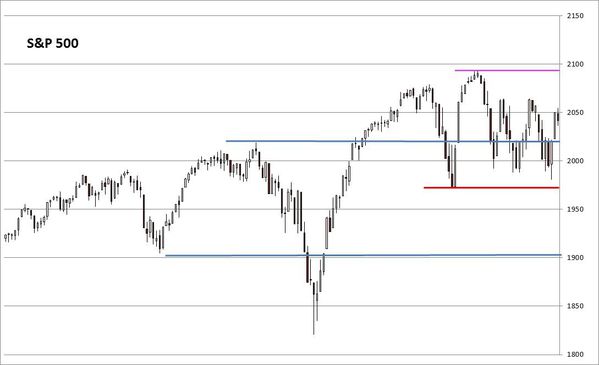
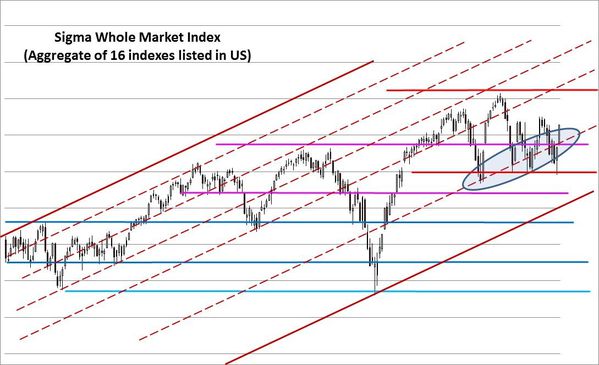
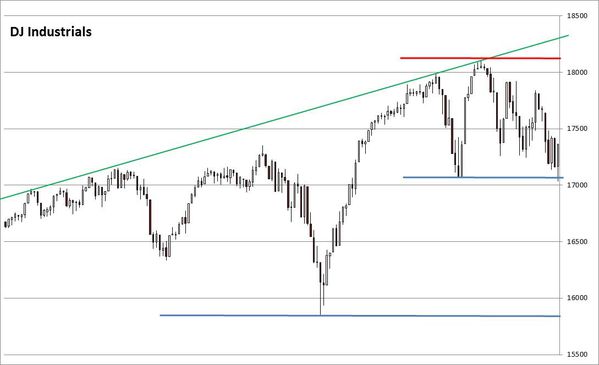
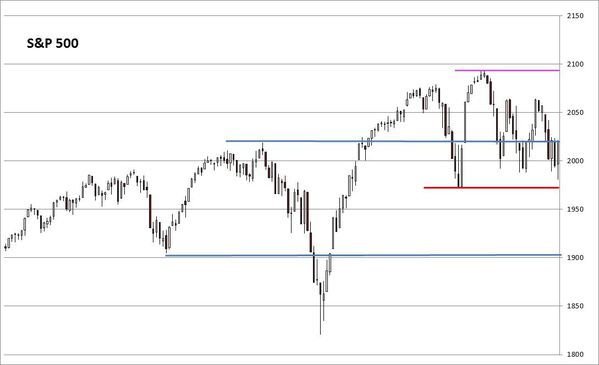
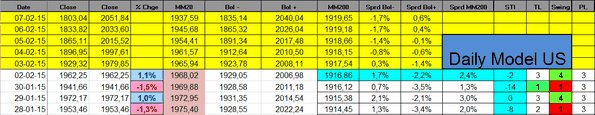
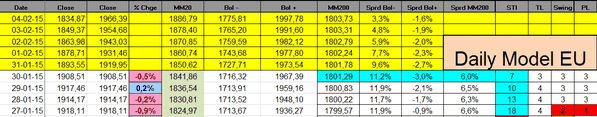
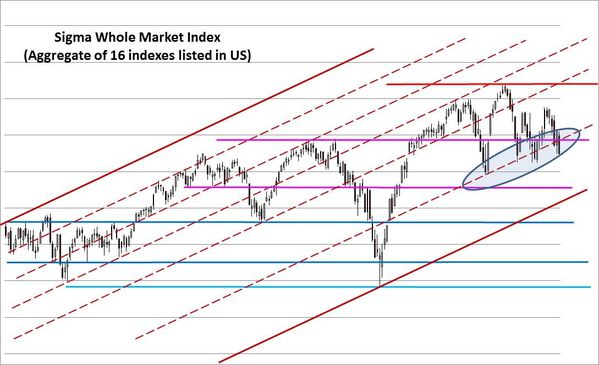
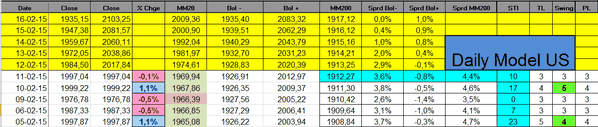
United States:
The Sigma Whole Market Index printed a 'doji'. The market remains in its trading range and there is no change in our view: wait and see.

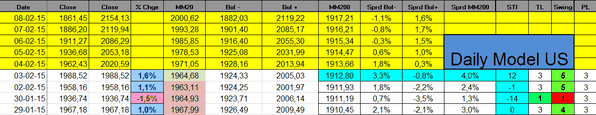
The Sigma Trend Index declined to '10' but remains in positive territory. Other indicators are neutral at '3'.
Daily Trading Book:
- SPX: stopped
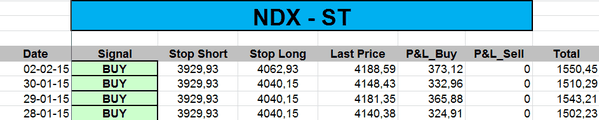
- NDX: long at 4236.28 (2014's close) (stop @ 4058, 5pts below the ST model to take into account bid/ask spread)
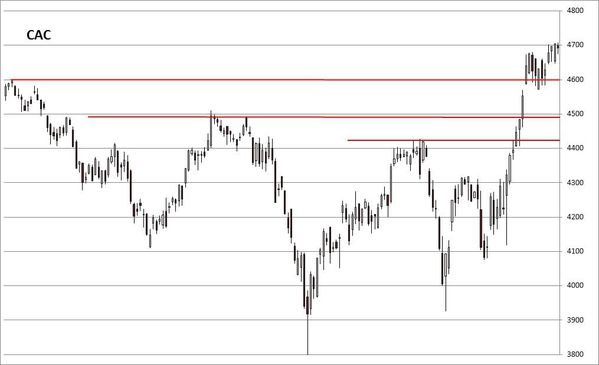
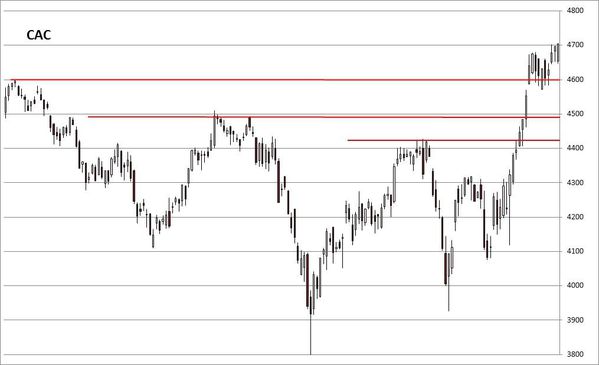
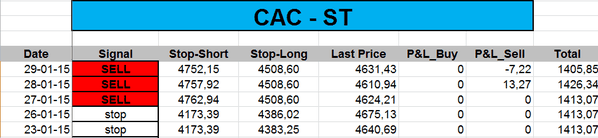
- CAC: short at 4659.35 (stop @ 4757, 5pts above the ST model to take into account bid/ask spread)
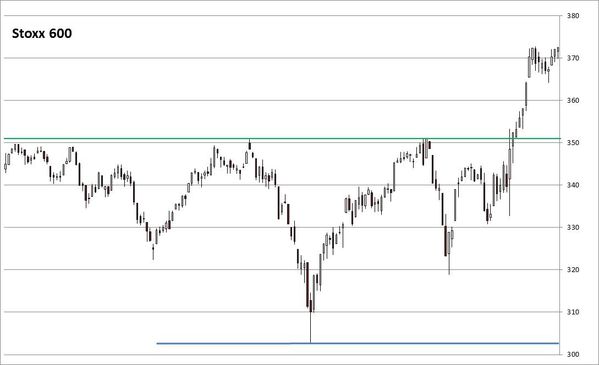
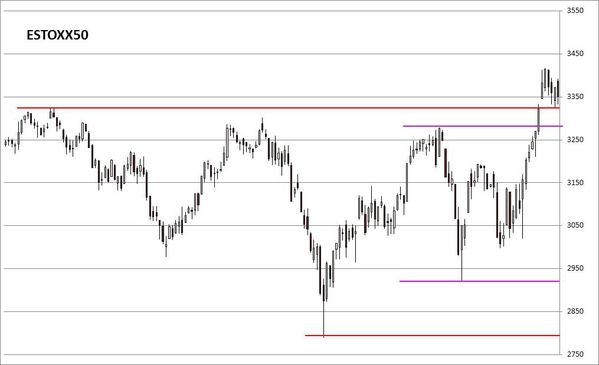
- EuroStoxx50: short at 3392.5 (stop @ 3465, 5pts above the ST model to take into account bid/ask spread)
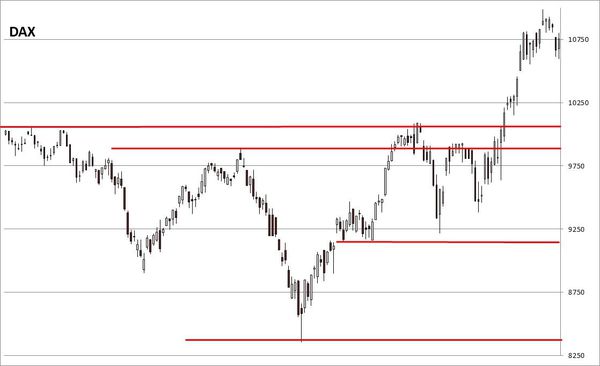
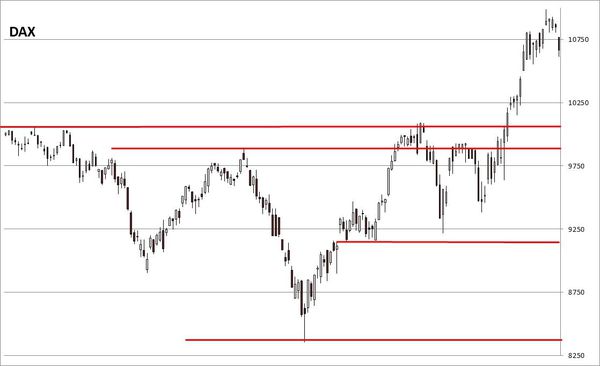
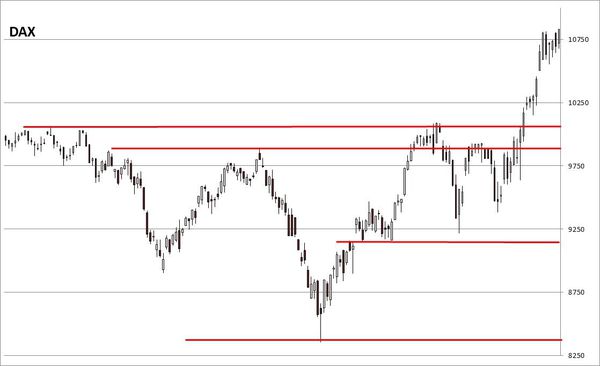
- DAX: stopped
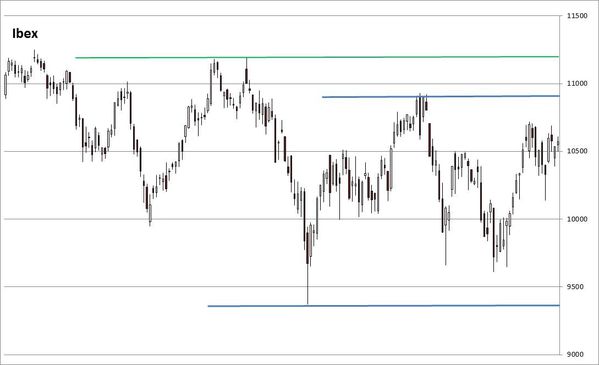
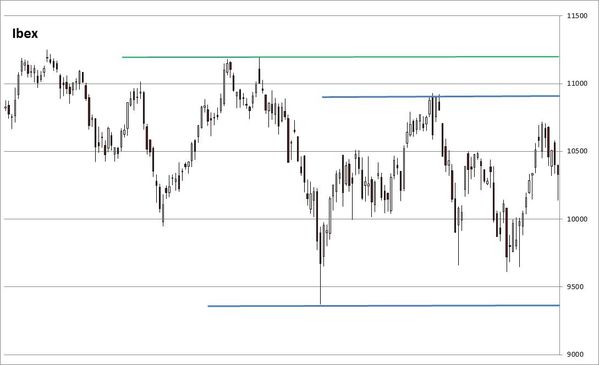
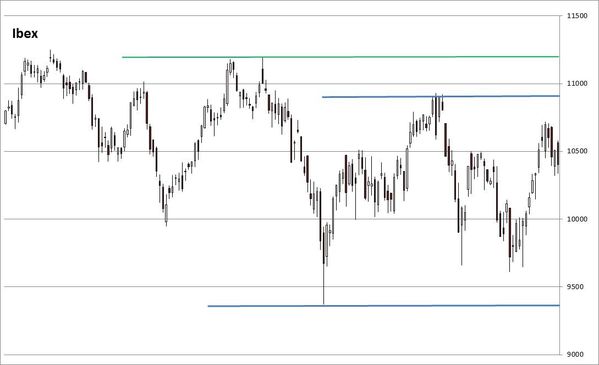
- IBEX: short at 10677.7 (stop @ 10823, 10pts above the ST model to take into account bid/ask spread)
Side bet:
- CAC: short at 4490.35
- EuroStoxx50: short at 3276.5
Partager cet article