Overblog
Suivre ce blog Administration + Créer mon blog
3 janvier 2015 6 03 /01 /janvier /2015 13:32

First of all, I want to wish you all the best to you and your family in 2015. And, a lot of good trades...


I want to take the opportunity of the first week-end of the year to post a sum up of all the trades we did in 2014.


S&P:

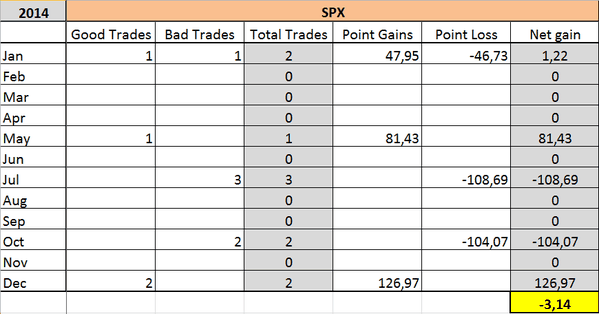
The SP500 is the only index for which we booked a small loss in 2014: 40% of good trades and avg gains 148% above avg losses.


10 trades: 4 good vs 6 bad

Avg gains for good trades: 64.09 pts/trade

Avg loss for bad trades: -43.25pts/trade


Total gains: -3.14pts


plspx20141231.PNG


Nasdaq 100:

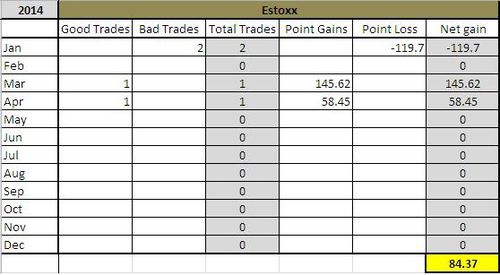
50% of good trades and avg gains 126% above avg losses.


10 trades: 5 good vs 5 bad

Avg gains for good trades: 135.62 pts/trade

Avg loss for bad trades: -107.72pts/trade


Total gains: 139.49pts


plndx20141231.PNG

CAC:

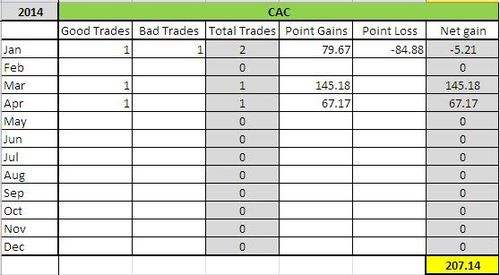
62% of good trades and avg gains in line with avg losses.


13 trades: 8 good vs 5 bad

Avg gains for good trades: 124.95 pts/trade

Avg loss for bad trades: -124.16pts/trade


Total gains: 378.8pts


plcac20141231.PNG

EuroStoxx:

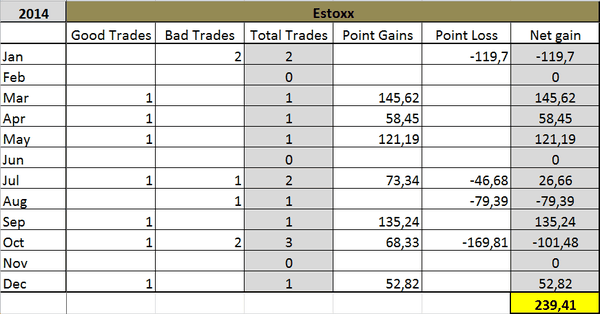
54% of good trades and avg gains 134% above avg losses.


13 trades: 7 good vs 6 bad

Avg gains for good trades: 93.57 pts/trade

Avg loss for bad trades: -69.59pts/trade


Total gains: 239.41pts


plestox20141231

IBEX:

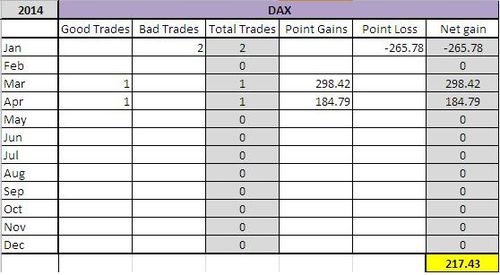
58% of good trades and avg gains 135% above avg losses.


12 trades: 7 good vs 5 bad

Avg gains for good trades: 306.51 pts/trade

Avg loss for bad trades: -227.58pts/trade


Total gains: 1007.68pts


plibex20141231.PNG


DAX:

The DAX is the index with the best return: 58% of good trades and avg gains 160% above avg losses.


12 trades: 7 good vs 5 bad

Avg gains for good trades: 356.4 pts/trade

Avg loss for bad trades: -221.73pts/trade


Total gains: 1386.13pts


pldax20141231.PNG

Partager cet article
Repost0
2 juillet 2014 3 02 /07 /juillet /2014 08:50

The Sigma Whole MArket Index had a very strong session on Tuesday. It seems nothing can stop this market.


SWM20140701.JPG

We have been underlying for a couple of weeks that both the Russell 2000 and the Small Caps 600 were much weaker than the rest of the market and that they were unable to print new highs. Now, this divergence has been cleared for the Small Caps 600 but not yet for the Russell 2000..


chartSC20140701.JPG

chartRUT20140701.JPG


The Sigma Trend Index surged to '45' (above the key '34' level) and the Swing was at '4', telling us the session was rather impulsive.


stmodel20140701.JPG


The NDX hit our stop loss and we booked a major loss: 3720.24 - 3881.13 = -160.89 (loss).


We are not happy with current trading performance but we are still positive on a ytd basis:

- CAC: +426.43 pts

- DAX: +405.96 pts

- Estox: +193.09pts

- IBEX: -270.91 pts

- SPX: +14.07 pts

- NDX: +122.85pts


Short Term Trading Book:


- SPX: short at 1912.06 (stop @ 1981, 3pts above the ST model to take into account bid/ask spread)

- NDX: stopped

- CAC: short at 4526.78 (stop @ 4621, 5pts above the ST model to take into account bid/ask spread)

- EStox: short at 3242.67 (stop @ 3354, 5pts above the ST model to take into account bid/ask spread)

- DAX: short at 9936.15 (stop @ 10085, 10pts above the ST model to take into account bid/ask spread)

- IBEX: short at 110496.6 (stop @ 11296, 10pts above the ST model to take into account bid/ask spread)


Medium Term Trading Book:


- No more medium term position at this stage.

Partager cet article
Repost0
13 avril 2014 7 13 /04 /avril /2014 12:43

Here is our year to date P&L review. In the case of the SPX, the long position opened in February is still open, this is the reason why we have less transactions on this index.


plspx20140411.JPG

plndx20140411.JPG

plibex20140411.JPG

plestox20140411.JPG

pldax20140411.JPG

plcac20140411.JPG

Partager cet article
Repost0
5 janvier 2014 7 05 /01 /janvier /2014 11:59

First of all, we want to share with you the P&L generated by our ST model since we updated the model in early May 2013. We are very pleased with the results generated on both the CAC and the NDX. Results are good on both the Eurostoxx and the SPX but  results are disappointing on the DAX.


plcac20131231.JPG

plndx20131231.JPG

plestox20131231.JPG

plspx20131231.JPG

pldax20131231.JPG


Looking at the chart of the Sigma Whole Market Index, there is no new information, but we have to admit that Friday's session looks like a 'doji'. So, the pullback could already be over (on a pure chartist basis). Wait and see..


usmarket20140103.JPG


There is no new information coming from our indicators: the Sigma Trend Index (STI) is close to its zero line while other indicators are neutral at '3'.


stmodel20140103.JPG


The ST model computed new stop levels on some of our positions:


stndx20140103.JPG

stdax20140103.JPG

stestix20140103.JPG


Short Term Trading Book:


- SPX: short at 1841.42 (stop @ 1876, 3pts above the ST model to take into account bid/ask spread)

- NDX: short at 3577.69 (stop @ 3661, 5pts above the ST model to take into account bid/ask spread)

- CAC: short at 4280.47 (stop @ 4411, 5pts above the ST model to take into account bid/ask spread)

- DAX: short at 9587.06 (stop @ 9638, 10pts above the ST model to take into account bid/ask spread)

- EStoxx: short at 3114.05 (stop @ 3162, 5pts above the ST model to take into account bid/ask spread)


Medium Term Trading Book:


- No more medium term position at this stage.


Out of model position: (hedge against a blow off rally like in 2000)


- 1 call NDX January 2014 strike 3700 @ 5.06

Partager cet article
Repost0

Presentation

  • : Le blog de sigmatradingoscillator
  • : Professionnel de la finance de marché depuis plus de 10ans, j'ai mis au point une série d'outils de trading me permettant de prendre et couper mes positions. Ici, j'écris un update quotidien sur la situation du CAC,DAX, Eurostoxx, SP500, Nasdaq100. Attention Les éléments repris dans ce blog représentent uniquement mon opinion personnelle et ne constituent en aucun cas une incitation au trading ou du conseil financier. Pour du conseil, consultez votre conseiller en placement
  • Contact

Disclaimer

NO MATERIAL HERE CONSTITUTES "INVESTMENT ADVICE" NOR IS IT A RECOMMENDATION TO BUY OR SELL ANY FINANCIAL INSTRUMENT, INCLUDING BUT NOT LIMITED TO STOCKS, COMMODITIES, OPTIONS, BONDS, FUTURES, OR BULLION. ACTIONS YOU UNDERTAKE AS A CONSEQUENCE OF OUR ANALYSIS, OPINION OR ADVERTISEMENT ON THIS SITE ARE YOUR SOLE RESPONSIBILITY.

FOR INVESTMENT ADVICE, PLAN A MEETING WITH A FINANCIAL ADVISOR IN ORDER TO ESTABLISH YOUR OWN RISK PROFILE.

Archives

Pages