13 novembre 2014
4
13
/11
/novembre
/2014
08:38
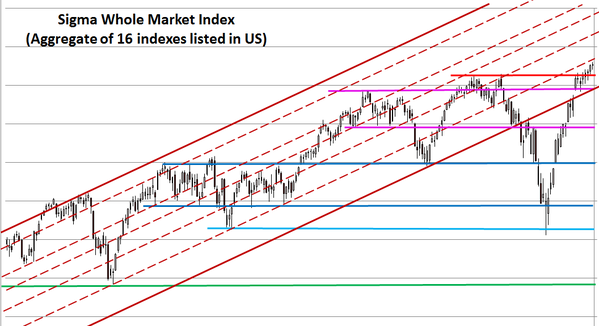
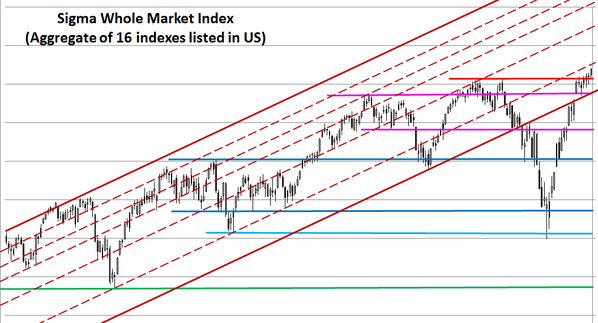
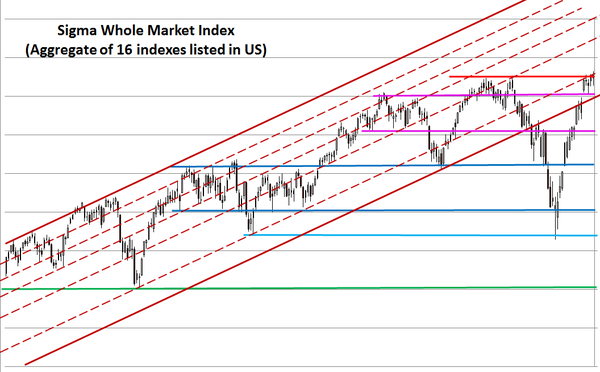
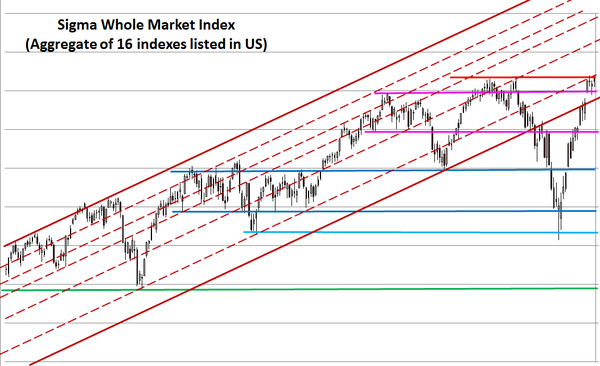
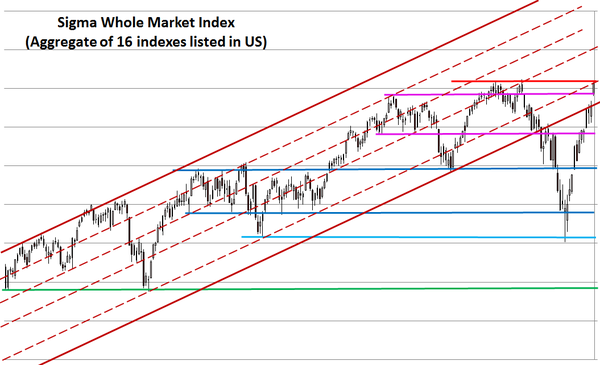
The Sigma Whole Market Index had a very quiet session. This index printed a new intraday high but had a flat close. We can detect a small doji for the day.
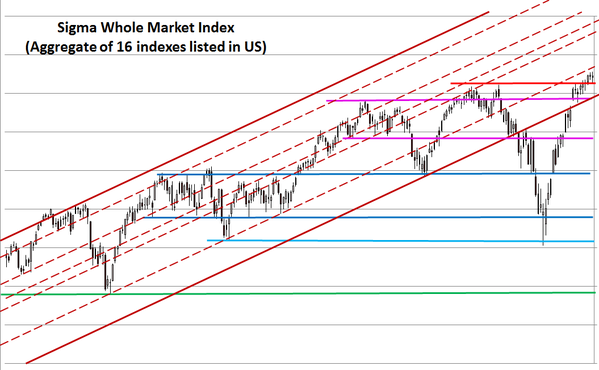
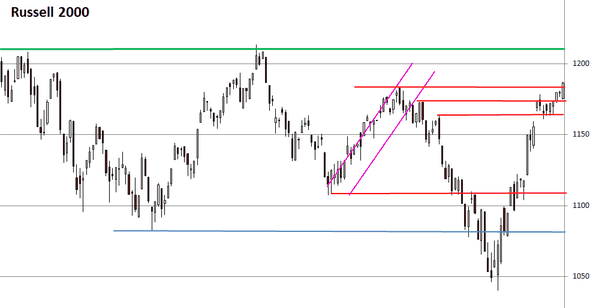
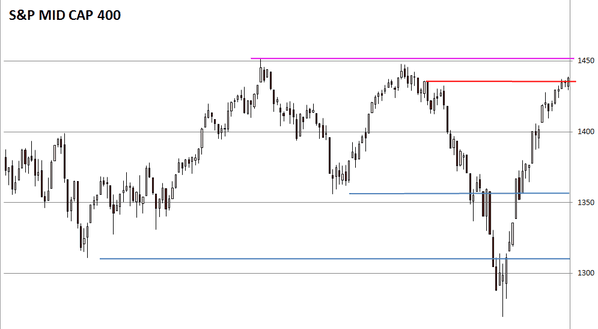
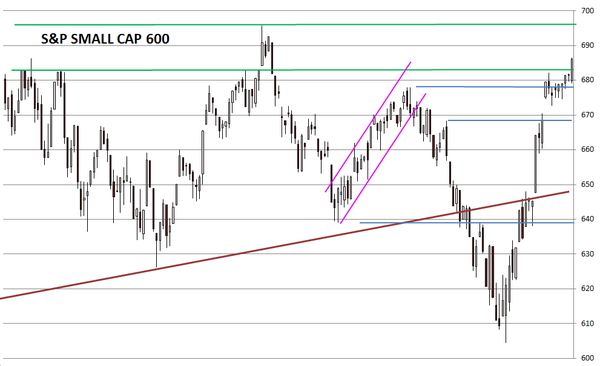
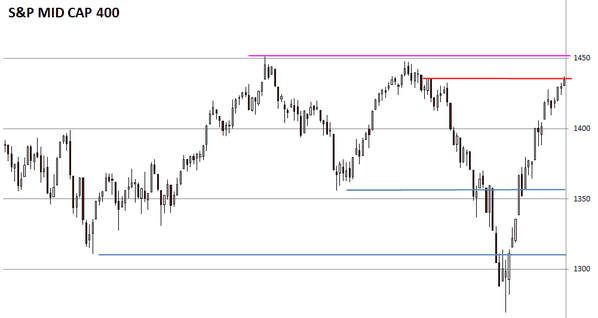
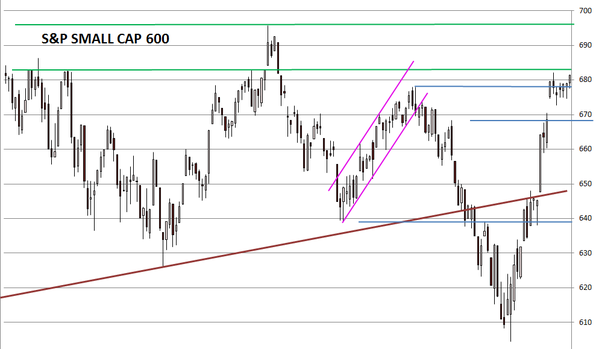
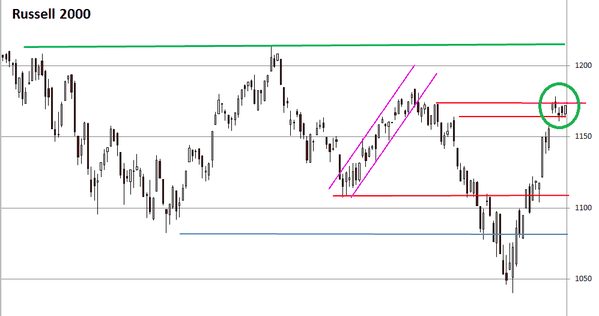
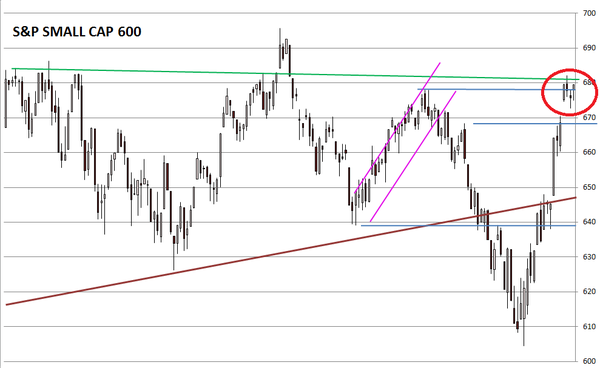
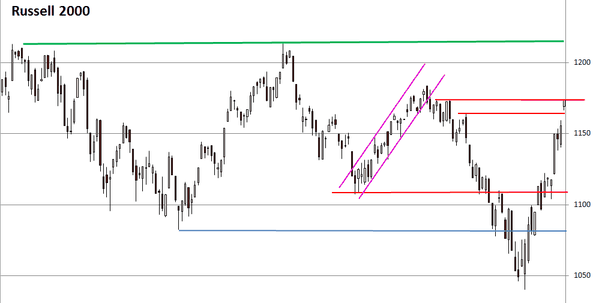
Nevertheless, it seems that some momentum is coming back on former key indexes: the Russell 2000, the Small Cap 600 and the Mid Cap400 are now breaking key resistances.
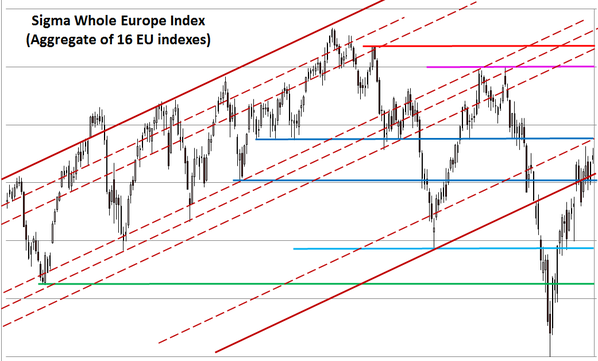
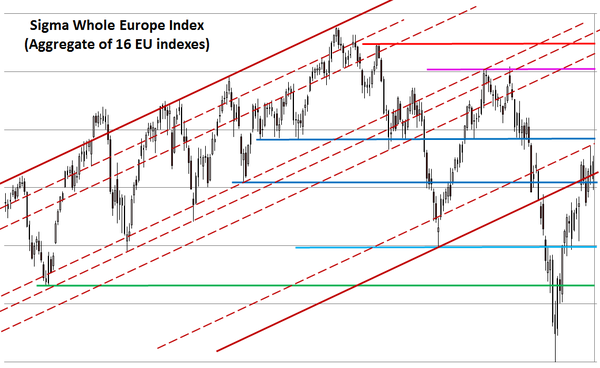
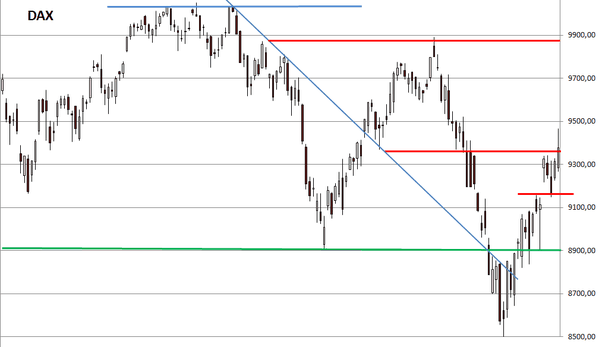
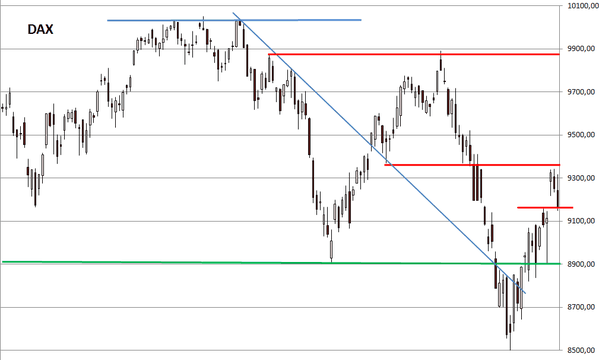
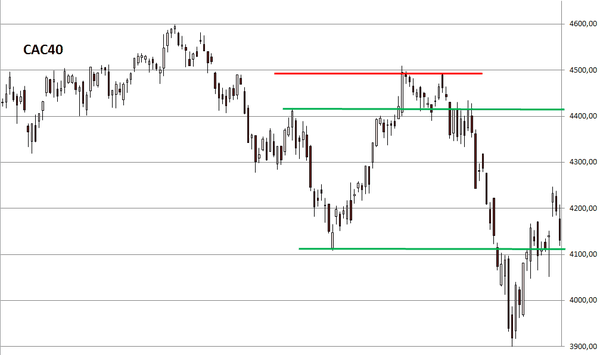
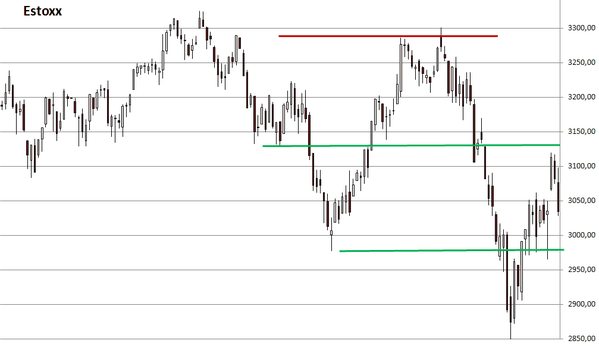
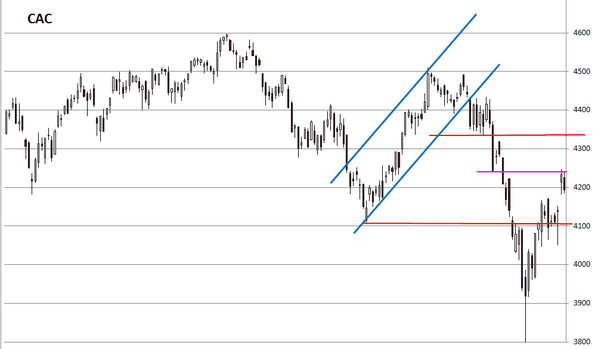
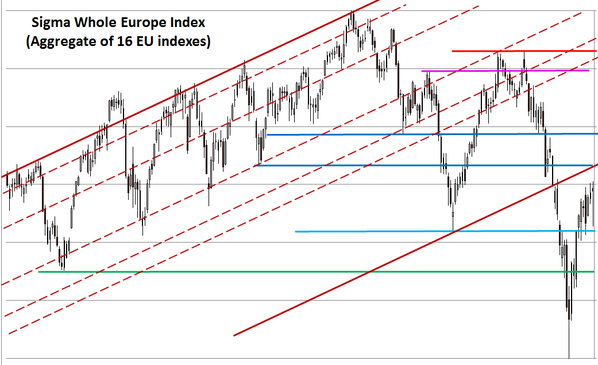
At the same time, the situation in Europe is very different. The Sigma Whole Europe had a bad session on Wednesday and this index is aready close to a major support. A strong bounce back is needed or this region will come back in trouble.
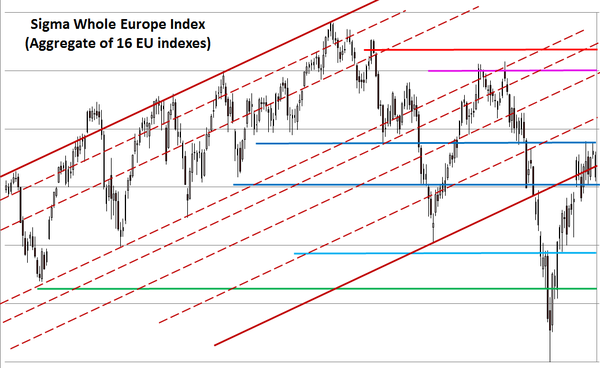
We have the same situation on both the CAC and the Stoxx600:


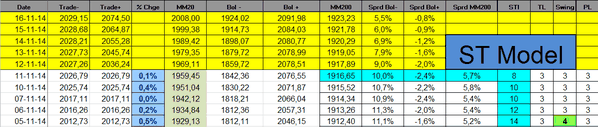
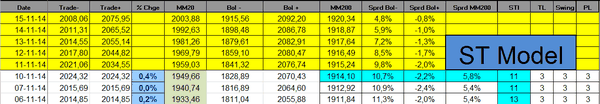
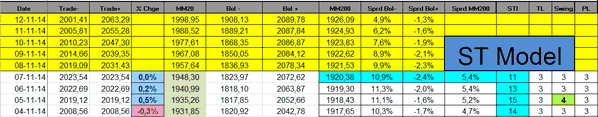
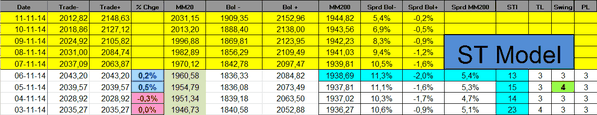
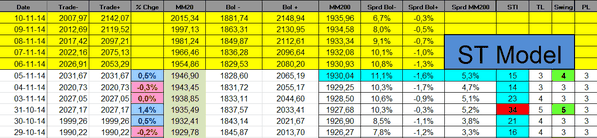
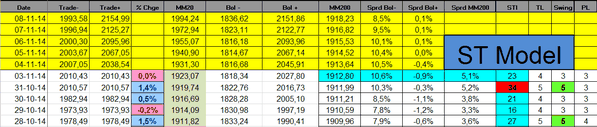
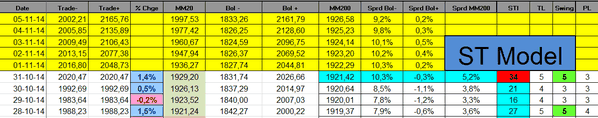
The Sigma Trend Index is unchanged at '8'. Other indicators were neutral at '3'.

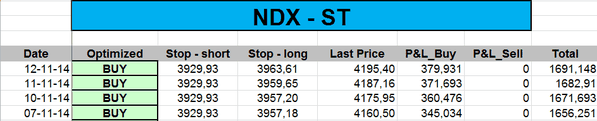
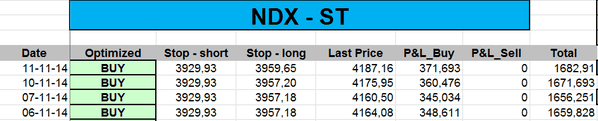
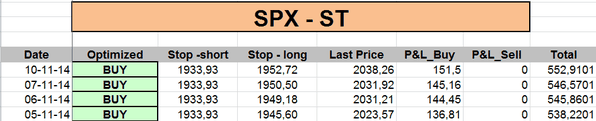
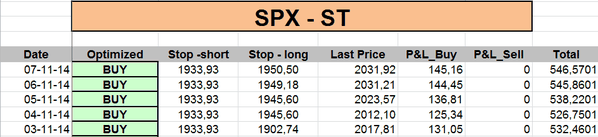
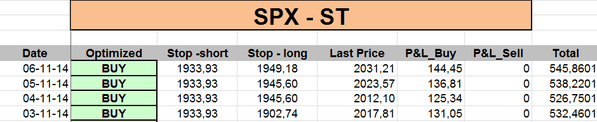
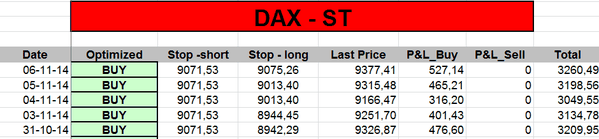
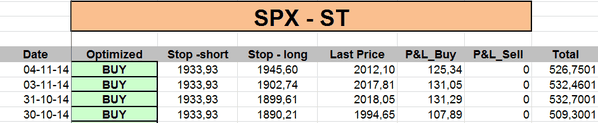
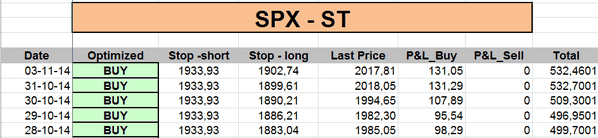
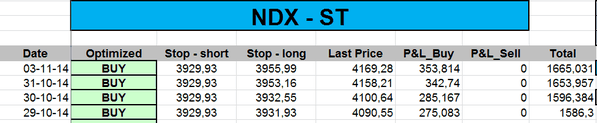
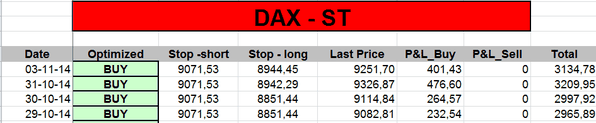
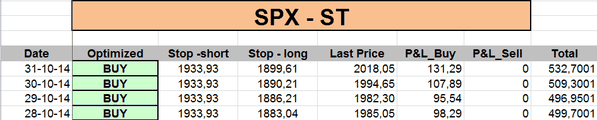
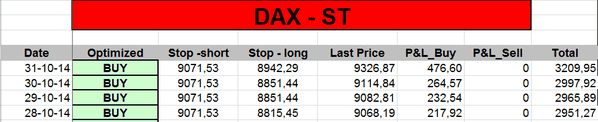
The ST model uplifted its stops on both the SPX and the NDX:

Short Term Trading Book:
- SPX: long at 1892.65 (stop @ 1953, 3pts below the ST model to take into account bid/ask spread)
- NDX: long at 3828.03(stop @ 3959, 5pts below the ST model to take into account bid/ask spread)
- CAC: stopped
- EStox: stopped
- DAX: long at 8769.25(stop @ 9104, 10pts below the ST model to take into account bid/ask spread)
- IBEX: stopped
Published by sigmatradingoscillator
-
dans
Market Analysis
12 novembre 2014
3
12
/11
/novembre
/2014
08:59
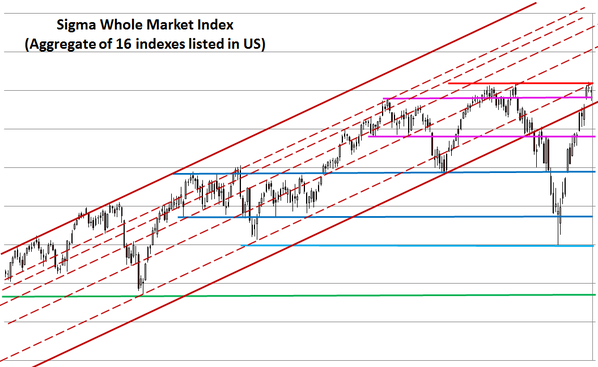
The Sigma Whole Market Index was able to print a new record high. The momentum is slowing fast but there is no warning sign at this stage.
In Europe, the situation remains unimpressive. As long as the market remains below the pink horizontal resistance, there is a high probability to get further weakness in this region.
There is no new information coming from our ST model. All indicators are neutral. Nevertheless, we can notice the Sigma Trend Index(STI) continnues to slide and it is not far from its zero line. This is another way to see that the momentum is declining.
The ST model uplifted its stops on both the NDX and the SPX:

Short Term Trading Book:
- SPX: long at 1892.65 (stop @ 1951, 3pts below the ST model to take into account bid/ask spread)
- NDX: long at 3828.03(stop @ 3955, 5pts below the ST model to take into account bid/ask spread)
- CAC: stopped
- EStox: stopped
- DAX: long at 8769.25(stop @ 9104, 10pts below the ST model to take into account bid/ask spread)
- IBEX: stopped
Published by sigmatradingoscillator
-
dans
Market Analysis
11 novembre 2014
2
11
/11
/novembre
/2014
10:13
The Sigma Whole Market Index printed a new 52 weeks high. There is no sign of reversal at this stage.
Looking at key US indexes, it seems the situation is in better shape than it was few weeks ago. Why? Because the Mid Cap400, Small Cap600 and Russell2000 are now catching up. Those indexes are not (yet) close to their 52 weeks high, but the situation is less extreme than it used to be few weeks ago. For sure, double ou triple tops remain a possible scenario that we have to monitor.

In Europe, the situation remains much less convincing.

The ST model didn't provide any new information. All indicators were neutral on Monday.
The ST model uplfted its stop on the SPX:
Short Term Trading Book:
- SPX: long at 1892.65 (stop @ 1950, 3pts below the ST model to take into account bid/ask spread)
- NDX: long at 3828.03(stop @ 3952, 5pts below the ST model to take into account bid/ask spread)
- CAC: stopped
- EStox: stopped
- DAX: long at 8769.25(stop @ 9104, 10pts below the ST model to take into account bid/ask spread)
- IBEX: stopped
Published by sigmatradingoscillator
-
dans
Market Analysis
9 novembre 2014
7
09
/11
/novembre
/2014
17:13
The Sigma Whole Market Index enjoyed a quiet session on Friday. It seems that the volatility is sharply declining. The market is consolidating at elevated levels and we see no warning signal at this time. Nevertheless, the triple top scenario remains still possible.

Looking at the Sigma Whole Europe Index, we can see the chart is much less bullish than the global one: recent rally only retraced 61.8% of the October's decline. This underlines that European markets remain in a dangerous situation. A sharp pullback remains a clear possibility.
The ST model didn't provide any new signal on Friday: all indicators were neutral.
The ST model uplifted its stops for both the DAX and the SPX:

Short Term Trading Book:
- SPX: long at 1892.65 (stop @ 1948, 3pts below the ST model to take into account bid/ask spread)
- NDX: long at 3828.03(stop @ 3952, 5pts below the ST model to take into account bid/ask spread)
- CAC: stopped
- EStox: stopped
- DAX: long at 8769.25(stop @ 9104, 10pts below the ST model to take into account bid/ask spread)
- IBEX: stopped
Published by sigmatradingoscillator
-
dans
Market Analysis
7 novembre 2014
5
07
/11
/novembre
/2014
07:36
The Sigma Whole Market Index was able to move above its key horizontal resistance. This sounds like a good sign.
Looking at some major US indexes, we can notice they made a "perfect" consolidaton and are now ready for further advance.

In Europe the situation is rather different. Even with the positive surprise from the ECB, major European indexes were notable to close above their resistance. Let's wait till the end of Friday's session.

There is no major change in our indicators.
The ST model uplifted its stops on some positions:
Short Term Trading Book:
- SPX: long at 1892.65 (stop @ 1946, 3pts below the ST model to take into account bid/ask spread)
- NDX: long at 3828.03(stop @ 3952, 5pts below the ST model to take into account bid/ask spread)
- CAC: stopped
- EStox: stopped
- DAX: long at 8769.25(stop @ 9065, 10pts below the ST model to take into account bid/ask spread)
- IBEX: stopped
Published by sigmatradingoscillator
-
dans
Market Analysis
5 novembre 2014
3
05
/11
/novembre
/2014
23:24
The Sigma Whole Market Index enjoyed a quiet and positive session on Wednesday. The market remains below its major resistance but there is no sign of reversal at this stage.
Recent action looks like a consolidation in an uptrend and we should be prepared for higher levels in coming sessions.
Most European indexes filled their gap (from Friday's open) on Tuesday and they resumed their advance on Wednesday.

Neither the Power Level (PL) nor the Swing index have been able to decline below '3' since last Friday. This means we didn't get any (negative) impulse signal since the Sigma trend Index hit the key '34' level. So, the warning is over and the ST model won't be able to generate a 'sell' signal.
There is no change in our trading book.
Short Term Trading Book:
- SPX: long at 1892.65 (stop @ 1943, 3pts below the ST model to take into account bid/ask spread)
- NDX: long at 3828.03(stop @ 3952, 5pts below the ST model to take into account bid/ask spread)
- CAC: stopped
- EStox: stopped
- DAX: long at 8769.25(stop @ 9003, 10pts below the ST model to take into account bid/ask spread)
- IBEX: stopped
Published by sigmatradingoscillator
-
dans
Market Analysis
5 novembre 2014
3
05
/11
/novembre
/2014
08:42
The Sigma Whole Market remains close to its resistance. Tuesday's session was rather bullish because the market was able to recover most of its early losses during the last hours of trading (rebounding from the pink horizontal support). This market is so strong, this is (nearly) unbelievable...
In Europe, most indexes filled their Friday's gap. So, the way is open for a new upleg. Let's see what happens in coming sessions.
The Sigma Trend Index continues to slide but both the Power Level(PL) and the Swing remain neutral at '3' => we have no confirmed 'sell' signal at this stage. If we don't get a confirmed 'sell' signal on Wednesday, the '34' level generated on the STI on last Friday will be cleared.

The ST model sharply uplifted its stops on our positions:


Short Term Trading Book:
- SPX: long at 1892.65 (stop @ 1943, 3pts below the ST model to take into account bid/ask spread)
- NDX: long at 3828.03(stop @ 3952, 5pts below the ST model to take into account bid/ask spread)
- CAC: stopped
- EStox: stopped
- DAX: long at 8769.25(stop @ 9003, 10pts below the ST model to take into account bid/ask spread)
- IBEX: stopped
Published by sigmatradingoscillator
-
dans
Market Analysis
4 novembre 2014
2
04
/11
/novembre
/2014
07:42
The Sigma Whole Market Index remains below its red horizontal resistance and it printed a 'doji' on Monday. So, there is some uncertainties in the market. Triple top or not? The question remains open at this stage.

Looking at some US and European indexes, we can notice some kind of reversal during the session. So, we will have to monitor if it is a consolidation after a huge rally or if it is the early stage of something more serious.
Looking at European indexes, it seems that recent advance is a rebound rather than the start of a new upleg (small retracement of the recent decline while US retraced nearly all the decline).


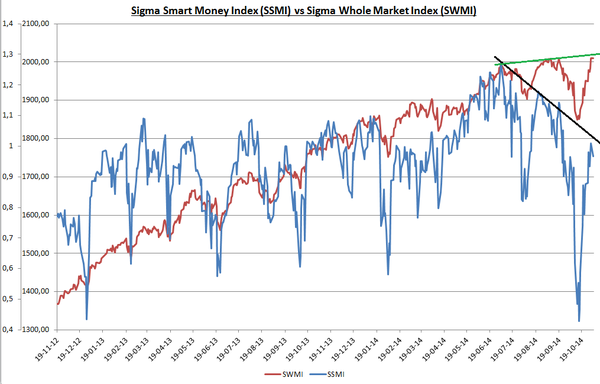
It is also interesting to underline the huge negative divergence between the Sigma Smart Money Index and the Sigma Whole Market Index. This is a major warning signal for the bull case.
Looking at our indicators, both the Swing and the Power Level (PL) were neutral on Monday (at '3'). So, there is no sell signal at this stage. (For more details on or methodology, you can click on the link in the right column).
The ST model uplifted its stops on our positions.
Short Term Trading Book:
- SPX: long at 1892.65 (stop @ 1900, 3pts below the ST model to take into account bid/ask spread)
- NDX: long at 3828.03(stop @ 3951, 5pts below the ST model to take into account bid/ask spread)
- CAC: stopped
- EStox: stopped
- DAX: long at 8769.25(stop @ 8934, 10pts below the ST model to take into account bid/ask spread)
- IBEX: stopped
Published by sigmatradingoscillator
-
dans
Market Analysis
2 novembre 2014
7
02
/11
/novembre
/2014
10:18
The Sigma Whole Market Index enjoyed a huge rally on Friday. Looking at the chart we can see we are right at previous high. So, either we break this resistance and print new records or we roll down and we print a triple top on the index.
The NDX cleared previous highs and is in record territory (Friday's gap is huge and could be an exhaution gap). But other indexes are much less impressive.

The most interesting point (for us) is that the Sigma Trend Index moved at '34' on Friday. This level is the required level in order to generate a sell signal. So, if we get an impulse (down leg) in the next 3 sessions, the ST model will generate a 'sell' signal.
The ST model uplifted its stops on all (remaining) positions:

Short Term Trading Book:
- SPX: long at 1892.65 (stop @ 1897, 3pts below the ST model to take into account bid/ask spread)
- NDX: long at 3828.03(stop @ 3948, 5pts below the ST model to take into account bid/ask spread)
- CAC: stopped
- EStox: stopped
- DAX: long at 8769.25(stop @ 8932, 10pts below the ST model to take into account bid/ask spread)
- IBEX: stopped
Published by sigmatradingoscillator
-
dans
Market Analysis
31 octobre 2014
5
31
/10
/octobre
/2014
08:41
There is nothing important this morning (we can say, see or analyze) because the BOJ decided to increase the size of its balance sheet (just when the Fed decided to limit it) and the equity market (around the world) loved the decision.
We know we should get a huge gap at the open but it will be interesting to see if the gains are sustainable or if the investors take this oportunity to sharply reduce their exposure to equities.

The Sigma trend Index will be important to monitor because a close abve the key '34' level on Friday would be the first element for a sell signal next week.

The IBEX was stopped on Thursday because this index declined below our stop level. (We had no position on this index but we want to report it for the ones who are interested by this index).
The ST model uplifted its stop for some indexes:

Short Term Trading Book:
- SPX: long at 1892.65 (stop @ 1887, 3pts below the ST model to take into account bid/ask spread)
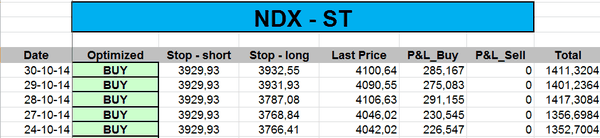
- NDX: long at 3828.03(stop @ 3928, 5pts below the ST model to take into account bid/ask spread)
- CAC: stopped
- EStox: stopped
- DAX: long at 8769.25(stop @ 8841, 10pts below the ST model to take into account bid/ask spread)
- IBEX: stopped
Published by sigmatradingoscillator
-
dans
Market Analysis


