13 mars 2012
2
13
/03
/mars
/2012
07:12
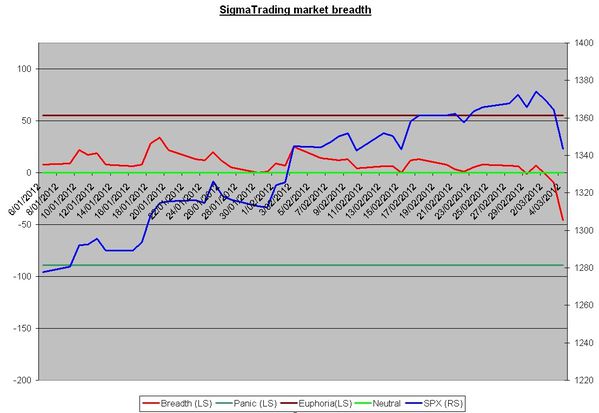
Our key indexes closed in positive territory on Monday (3rd consecutive day), confirming the view we expressed during the week-end that the next upleg will probably occur this week.
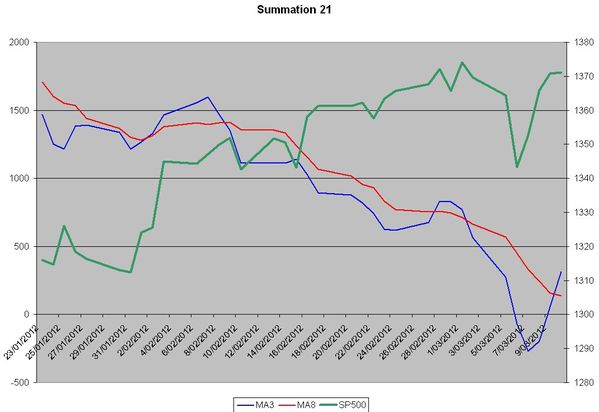
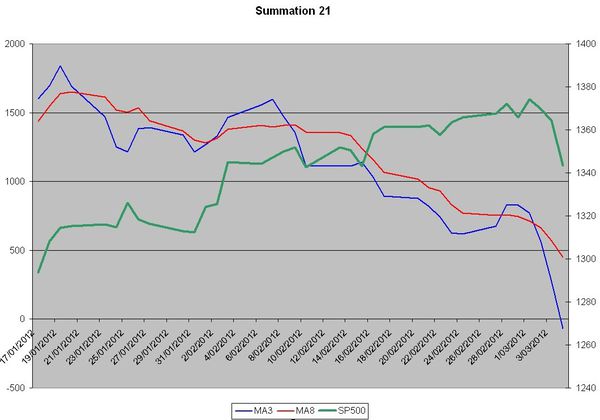
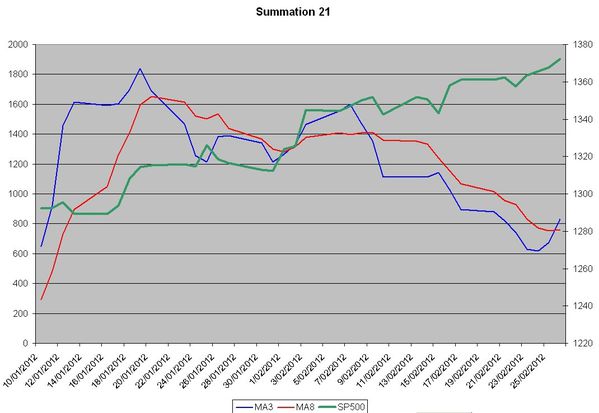
The summation 21 gave a fresh buy signal on Monday.
Conclusion:
The market seems overextended, but we have to respect our indicators, a buy signal remains a buy signal, and we don't want to dismiss it.
Nevertheless, we have to notice that the last signal (sell signal) was reversed after one day. So, when market enters in this kind of period (distribution period), this is usually when we are close to top or bottom in the market.
Have a nice day,
SigmaTradingOscillator
Published by sigmatradingoscillator
-
dans
Market Analysis
11 mars 2012
7
11
/03
/mars
/2012
22:47
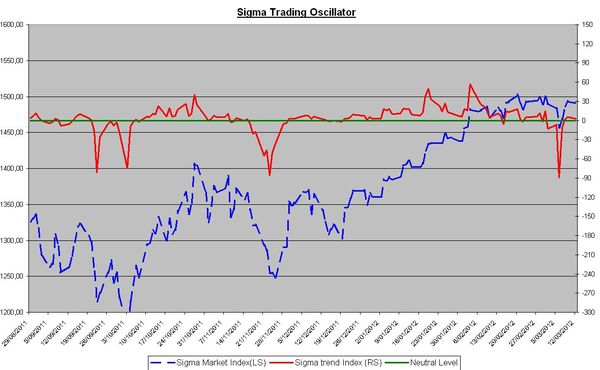
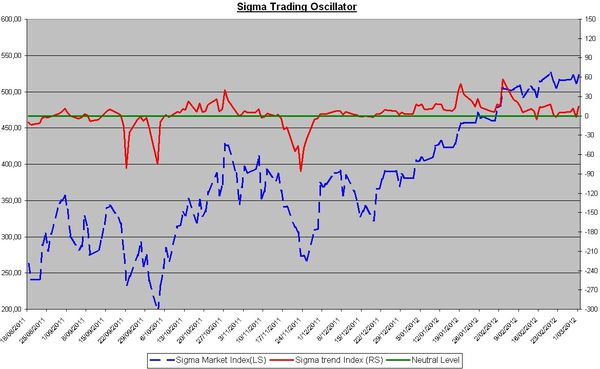
Our key indexes bounced back above the zero line, telling us the downtrend is (once again) postponed.
More important, as both indexes closed for the second consecutive day in positive territory, there is a high level of probability that a new upleg will start next week.

It looks like the Sigma Trend Index replicates its December's pattern.
Have a nice day,
SigmaTradingOscillator
Published by sigmatradingoscillator
-
dans
Market Analysis
9 mars 2012
5
09
/03
/mars
/2012
07:28
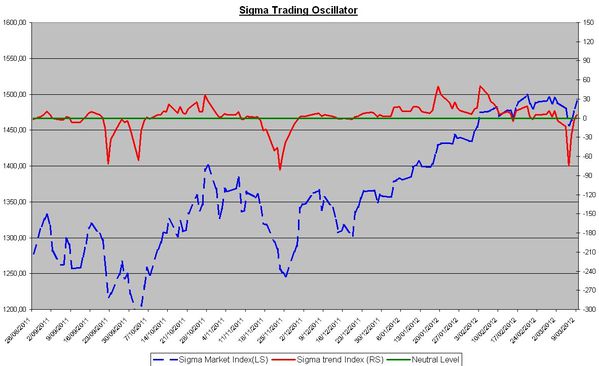
On Thursday, market continued its bounce back, and our key indicators closed above the zero line (for the first time).
Friday's close will be crucial in order to see if the market can close above the zero line for the second time.
If it was the case, this would invalidate the sell signal we got earlier in the week.
Have a nice day,
SigmaTradingOscillator
Published by sigmatradingoscillator
-
dans
Market Analysis
8 mars 2012
4
08
/03
/mars
/2012
05:44
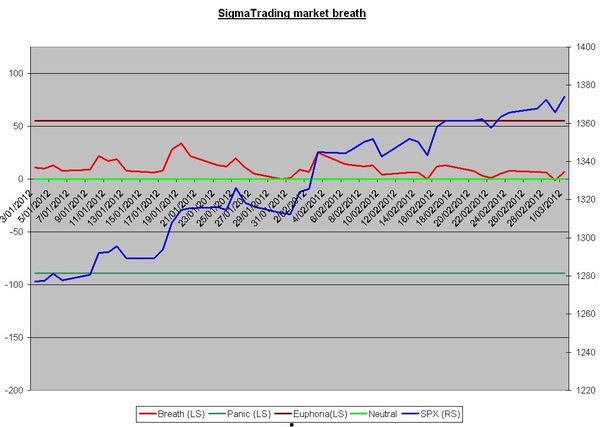
As we wrote following Tuesday's session: "... our Sigma Trend Index is already at oversold levels (-77), and this happened in 3 sessions only!!!! A short term bounce back could happen from these levels, but what is next?..."
And indeed, the market bounced back on Wednesday from oversold territory. But the big question remains: What is next?
It is important to see if the Sigma Trend Index and the Breadth Index are able to close for 2 consecutive sessions above the zero line. As long as they remain in negative, it means we are (at least) in presence of a short term correction.
If in coming days our key indicators start to deteriorate gradually, with prices declining faster than our indicators, then a sharp correction will be on the agenda.


Have a nice day,
SigmaTradingOscillator
Published by sigmatradingoscillator
-
dans
Market Analysis
6 mars 2012
2
06
/03
/mars
/2012
22:53
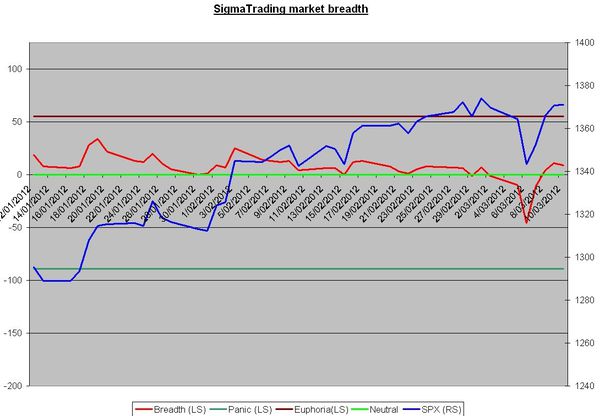
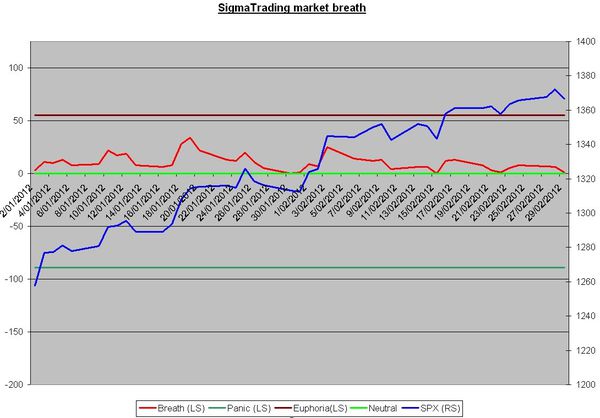
Following Monday's session, we were waiting for a confirmation from our breadth index that the uptrend was over.
This is done tonight.
It is important to notice the violence of this trend reversal: our Sigma trend Index is already at oversold levels (-77), and this happened in 3 sessions only!!!
A short term bounce back could happen from these levels, but what is next?
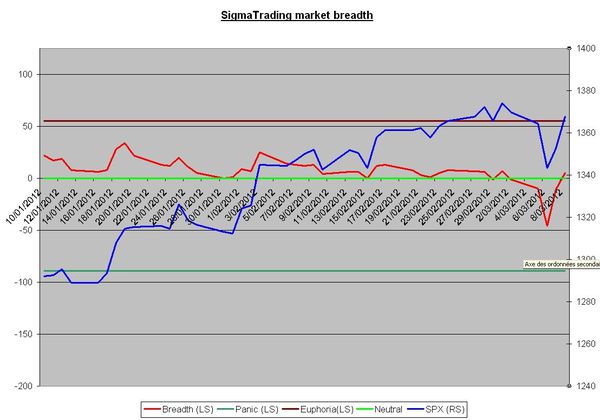
The breadth index closed for the second time in negative territory, confirming a trend reversal signal.
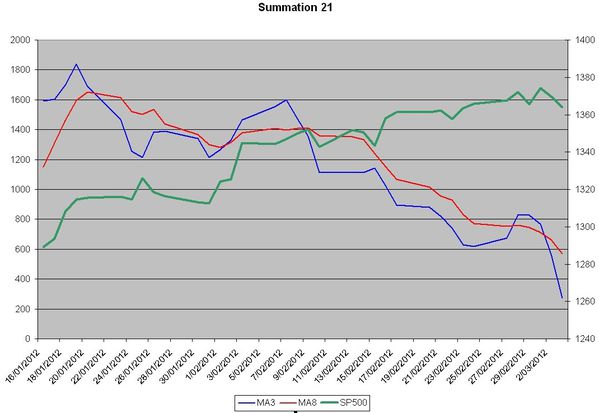
The summation 21 index continues to quickly deteriorate. We are now close to negative territory on this index too (left scale).
Conclusion:
When we look at price action in famous index such as SP500, Nasdaq and DJ Industrial, it looks like this move is just a pullback in an uptrend.
When we look at damages in our Sigma Trend Index, Breadth Index and the Summation 21 Index, it sounds like something really bearish is under development.
For sure, some indexes are heavily oversold (Dow jones Transport and Russell 2000) and this situation could trigger a short term bounce back. But if the Breadth Index and the Sigma Trend Index can't move quickly in positive territory, then a sharp correction will occur.
Have a nice day,
SigmatradingOscillator
Published by sigmatradingoscillator
-
dans
Market Analysis
6 mars 2012
2
06
/03
/mars
/2012
07:06
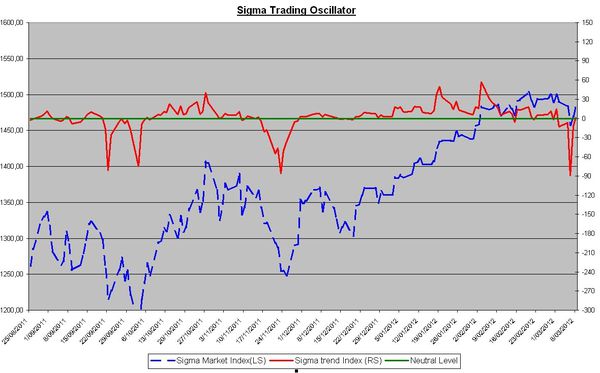
Following Monday's session, our Sigma Trend Index closed for the second time in negative territory, giving us a confirmed sell signal.

The breath index closed for the first time in negative territory, so we need one more close in negative territory to get a confirmed sell signal from this indicator.

The summation 21 index continues to deteriorate, confirming last Friday sell signal. You can notice we are not far from negative territory (left scale).
The turnover index continues to deteriorate too.

Conclusion:
Based on our Sigma trend Index, we got the first signs of a trend reversal. We would like to get a confirmation from our breath index.
Have a nice day,
SigmaTradingOscillator
Published by sigmatradingoscillator
-
dans
Market Analysis
5 mars 2012
1
05
/03
/mars
/2012
07:14
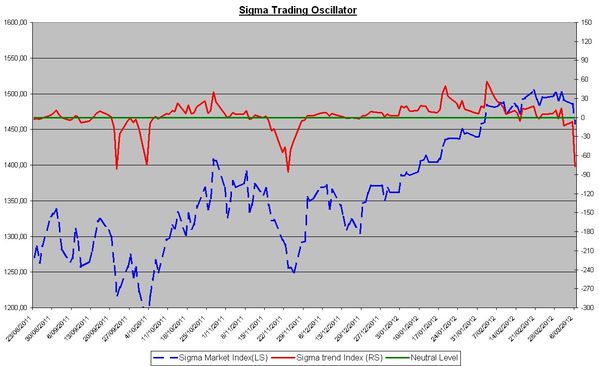
Following Friday's session, most of our indicators turned negative.
Don't forget we need two consecutive closes in negative territory for a trend reversal signal.
Our Sigma Trend Index reached a new low at -11.

Our breath indicator is slightly lower, but we need 2 consecutive closes in negative territory in order to get a trend reversal signal.

The turnover index gave a fresh sell signal on Friday.

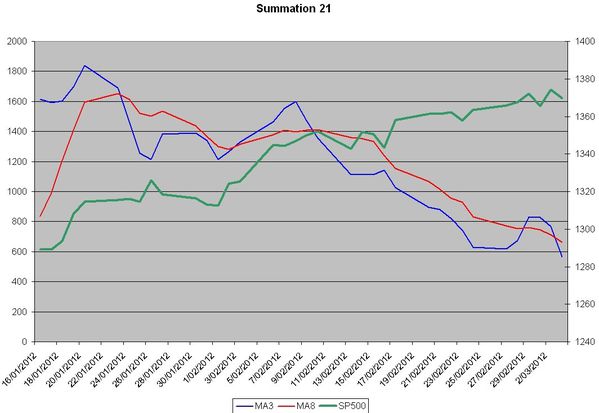
The summation 21 gave a new sell signal too. Moreover, we can notice that the summation 21 made lower high and lower low since mid January, signalling an important negative divergence with prices.
Conclusion;
We remain focus on both the breath and the Sigma Trend index because they were the most accurate in telling us: "the uptrend is weak but still alive". We want/need a trend reversal signal in those indexes.
Have a nice day,
SigmaTradingOscillator
Published by sigmatradingoscillator
-
dans
Market Analysis
2 mars 2012
5
02
/03
/mars
/2012
07:11
It starts to be boring and frustrating, but our key indicators bounced back. Once again they avoided a second close in negative territory.
So the uptrend remains in place.
Have a nice day,
SigmaTradingOscillator
Published by sigmatradingoscillator
-
dans
Market Analysis
1 mars 2012
4
01
/03
/mars
/2012
07:14
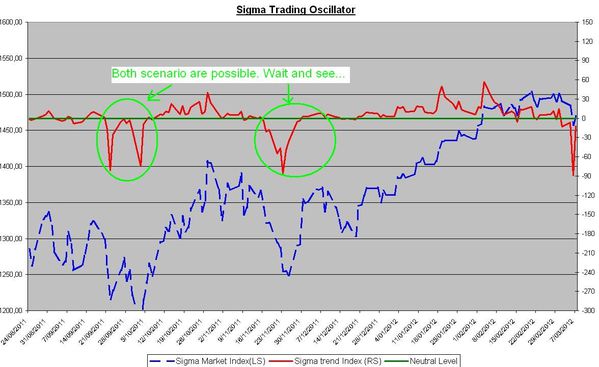
Following yesterday's session, both our Sigma trend Index and the Breath Index weakened.
They are now close to the zero line. In order to validate a trend reversal, we need 2 consecutive closes below the zero line.
This is not the first time this year that the Sigma Trend Index declined below the zero line, but each time it bounced back after one day in negative territory. This move indicated we were in presence of a weakening uptrend but not in presence of a trend reversal.

Conclusion:
We need to be patient, and we must wait for a trend reversal signal from our indicator.
Have a nice day,
SigmaTradingOscillator
Published by sigmatradingoscillator
-
dans
Market Analysis
28 février 2012
2
28
/02
/février
/2012
22:42
Market is overbought, no doubt about that.
It looks like nothing can stop this market and it will probably be painful when the market reverses, but as long as it holds, bulls are on the right side and bears are losing money and patience.
Our Sigma trend Index slightly improved today, telling us the uptrend is regaining some momentum.

At the same time, our Summation 21 index gave a fresh buy signal
We are really surprised by the length in time and in percentage of this upleg, but we don't have any sign of trend reversal for the time being.
Published by sigmatradingoscillator
-
dans
Market Analysis


