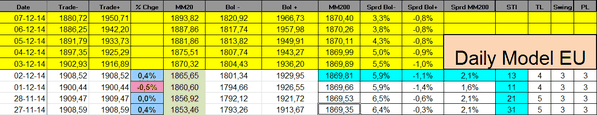
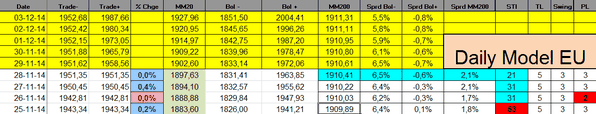
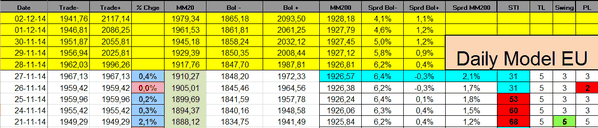
Europe:
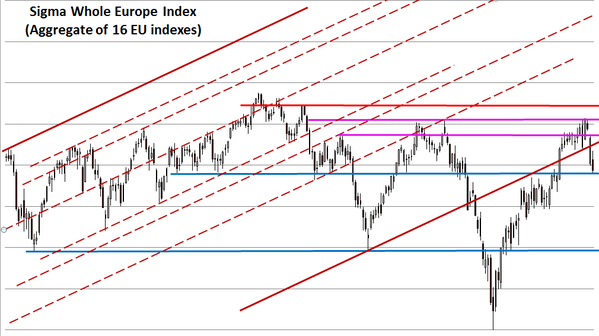
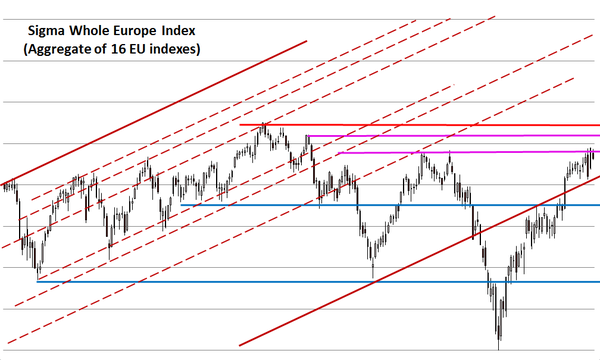
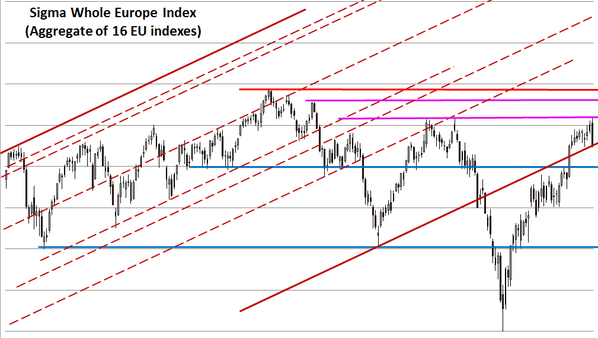
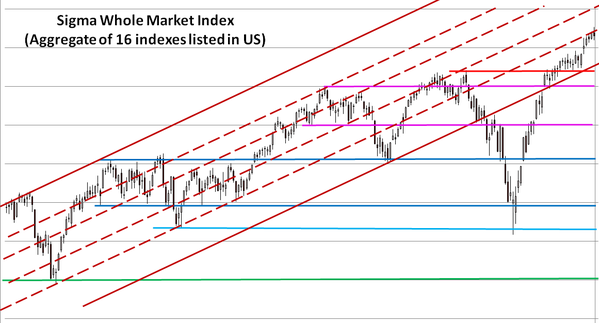
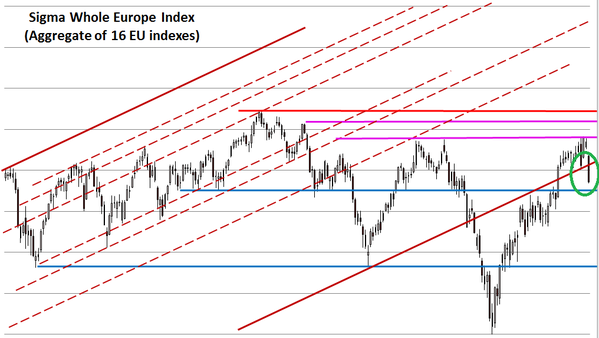
The Sigma Whole Europe Index had a difficult session on Tuesday. This index sharply declined and broke the (red) uptrend. Looking at the size of the black candle, there is no doubt the decline was impulsive.
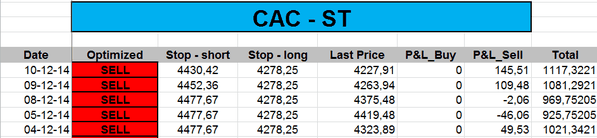
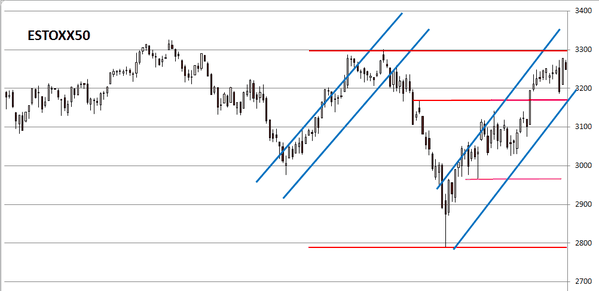
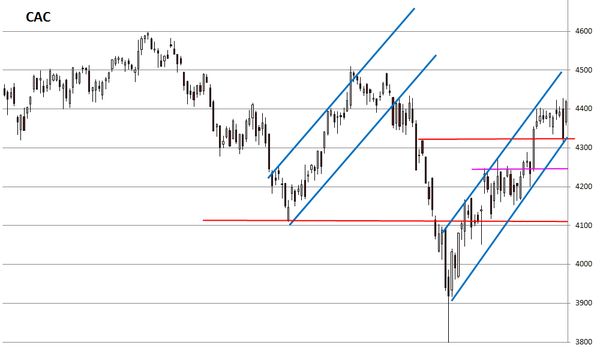
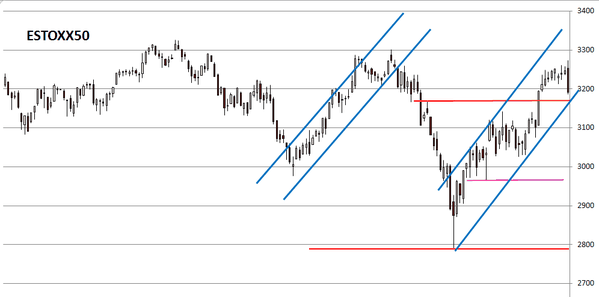
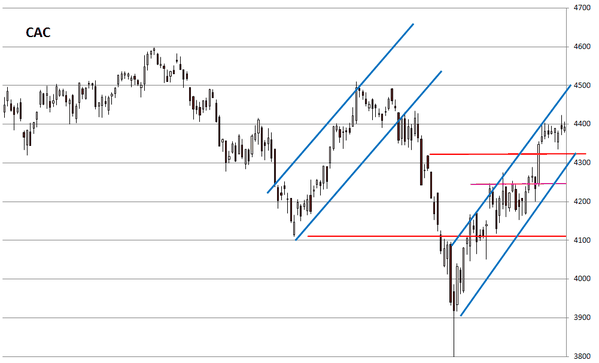
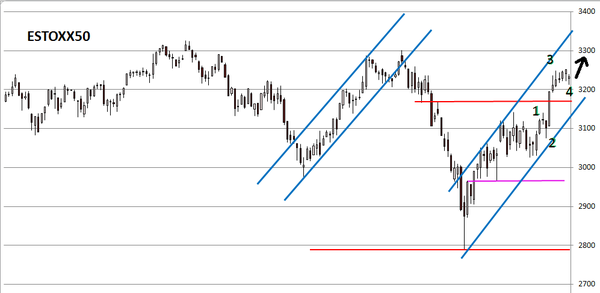
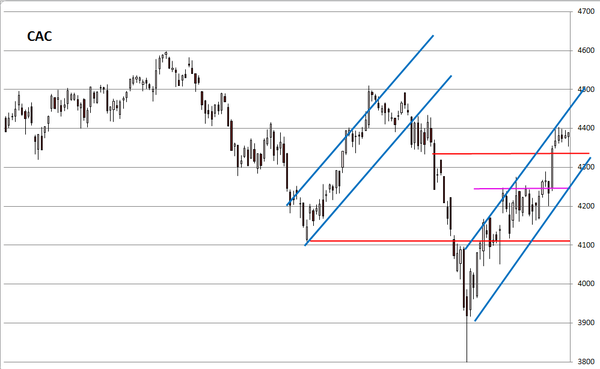
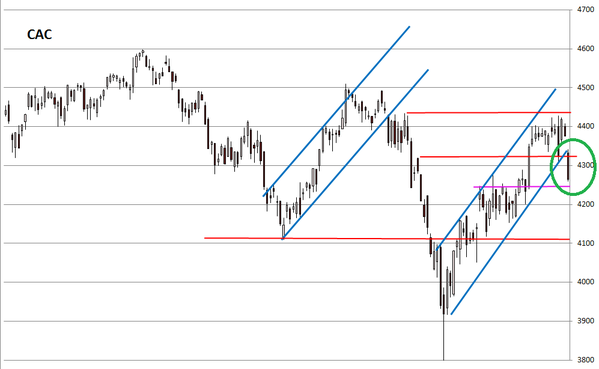
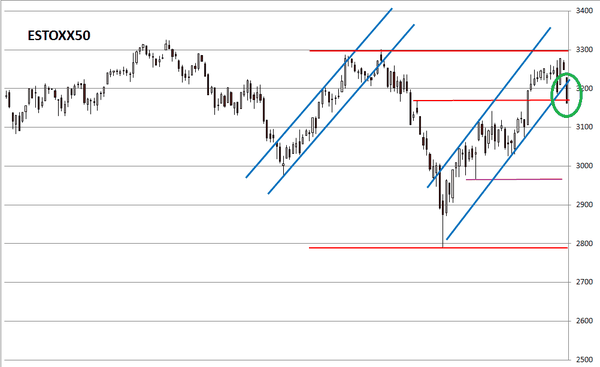
Looking at key European indexes, we can notice that both the CAC and the EuroStoxx50 broke their (blue) uptrend channel. The CAC is close to a solid support and we wouldn't be surprised if we get a bounce back in order to (at least) retest the uptrend channel by the south.
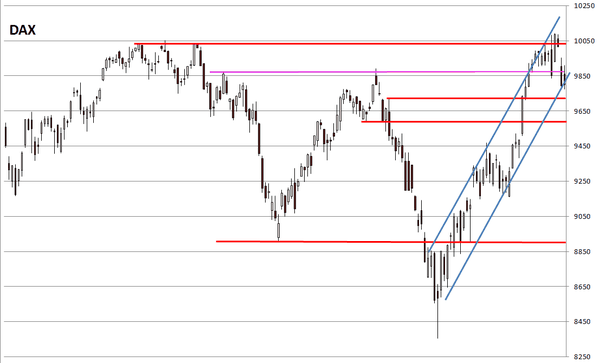
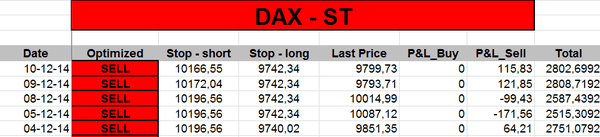
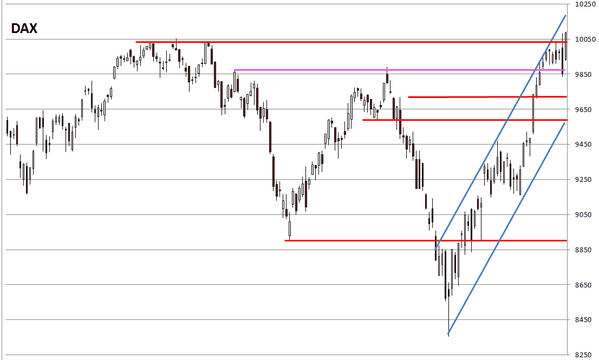
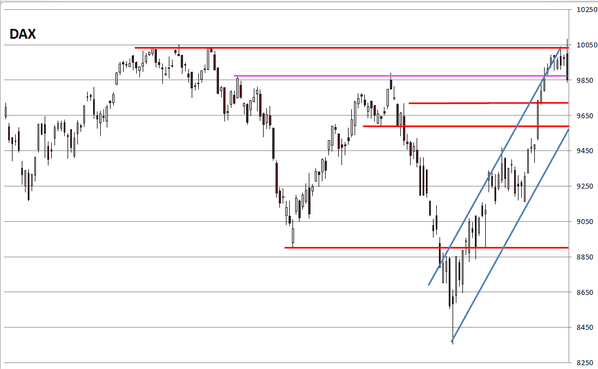
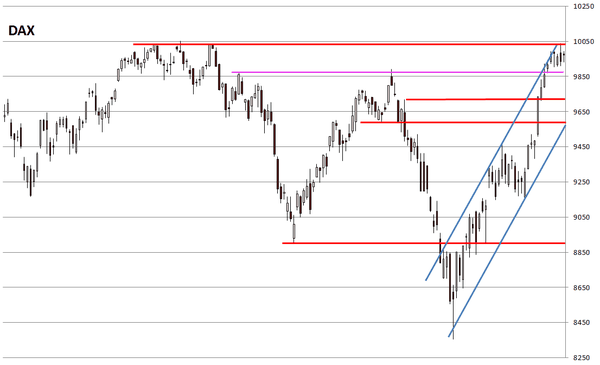
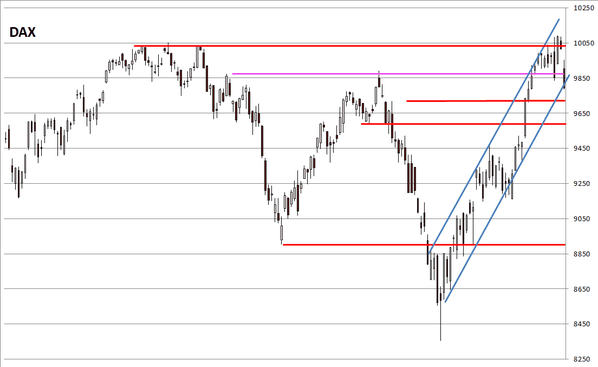
The DAX didn't break its uptrend so the situation is less dramatic than on other European indexes.
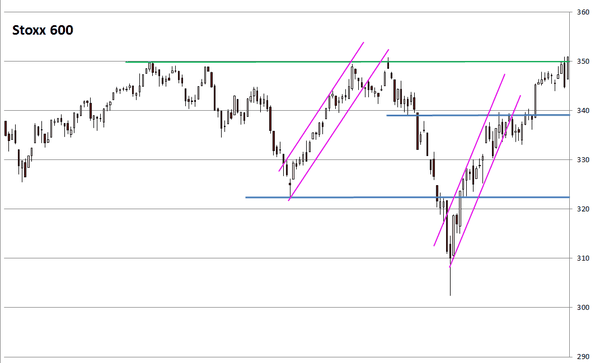
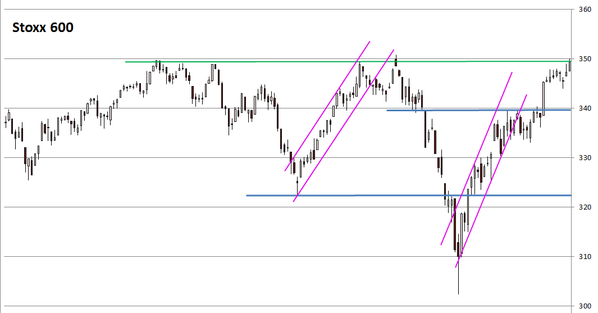
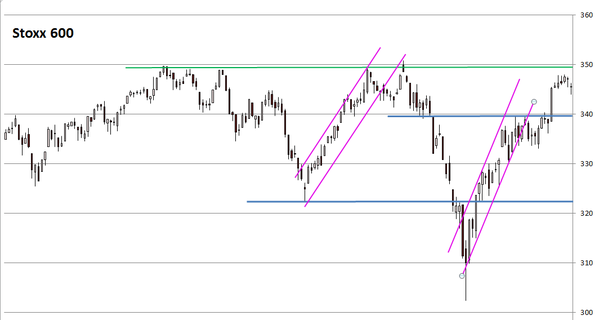
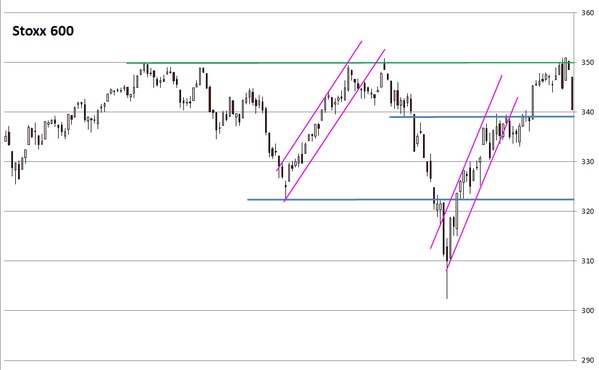
The Stoxx600 is right on a major support. A bounce back from current level is possible; we would be surprised to get a decline on a straight line.
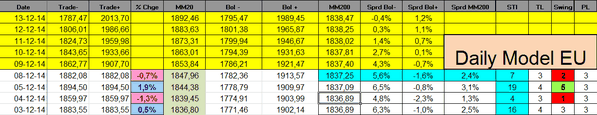
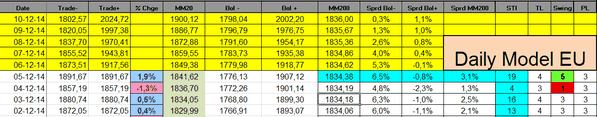
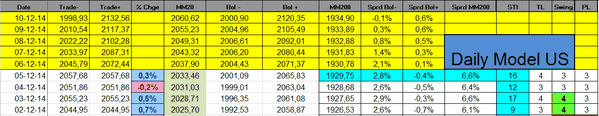
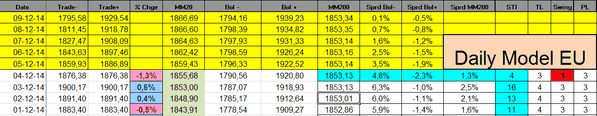
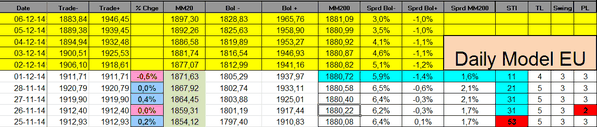
Looking at our indicators, the Swing came in at '1', telling us the decline was highly impulsive. The Sigma Trend Index declined in negative territory. The situation is clearly turning bad in Europe.

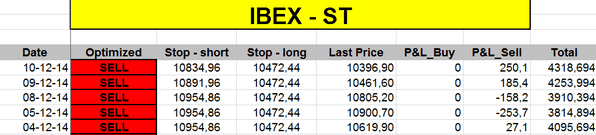
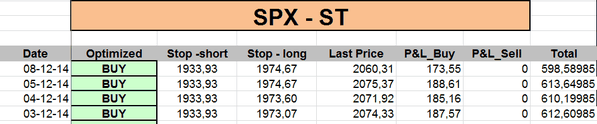
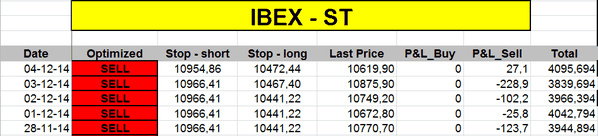
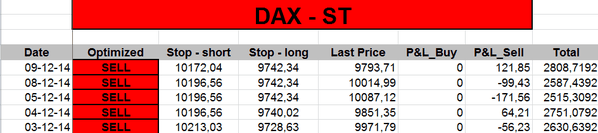
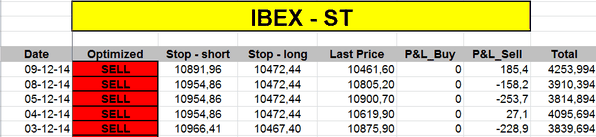
The ST model lowered its stops on all our European positions:


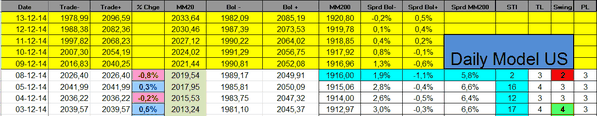
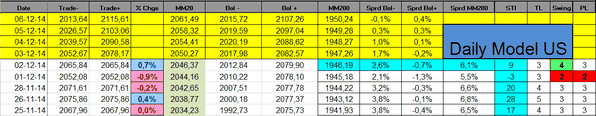
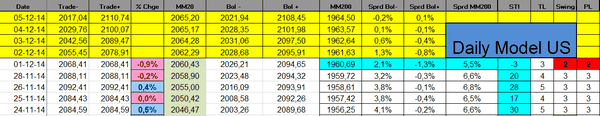
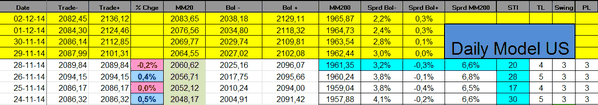
United States:
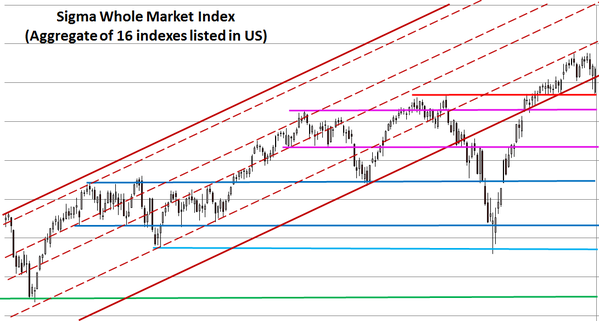
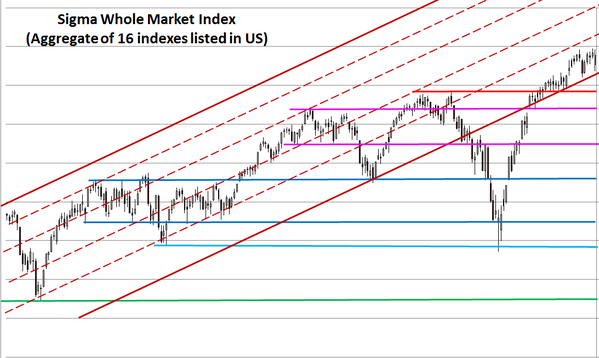
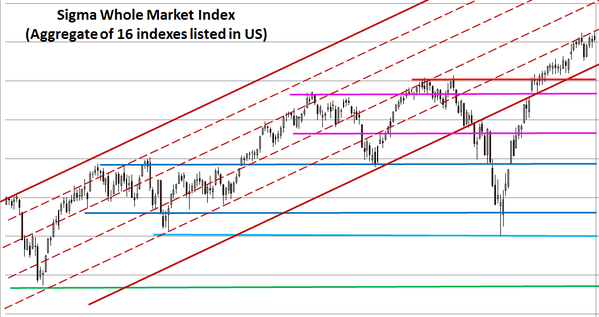
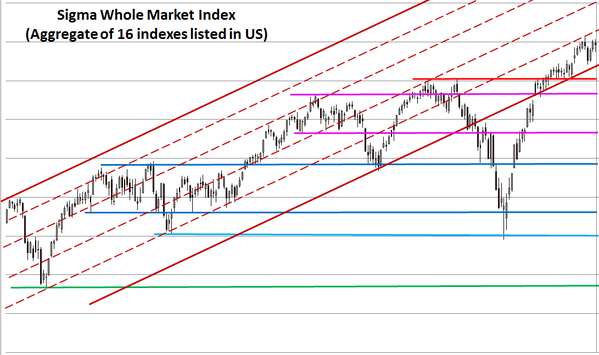
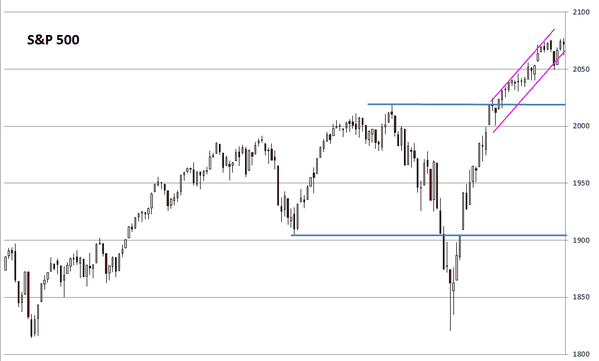
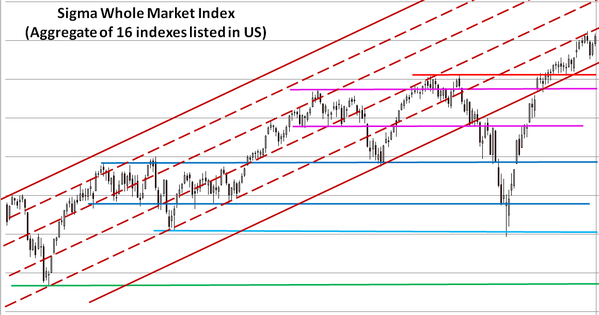
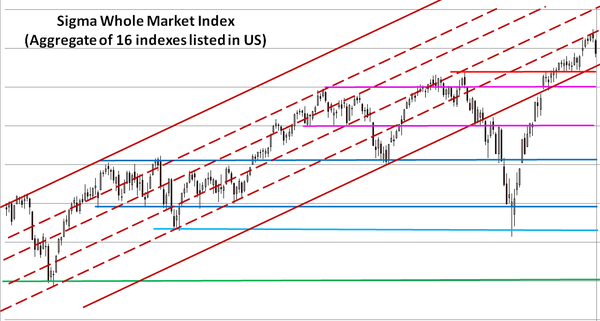
The Sigma Whole Market Index had a bad start but it was able to recover most of its losses. The market broke its uptrend channel on an intraday basis but it was able to close in the uptrend channel. So, Tuesday's action looks (at this stage) like a major warning signal rather than a trend reversal.
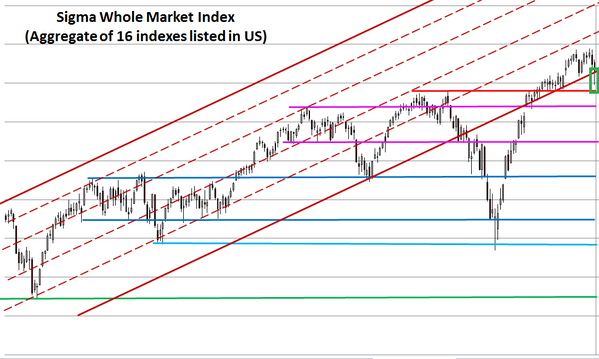
Another warning signal comes from the Sigma Trend Index where we can notice a major negative divergence between the Sigma Whole Market Index and the Sigma Trend Index. Usually, this kind of negative divergence is the early sign of a correction in the market.

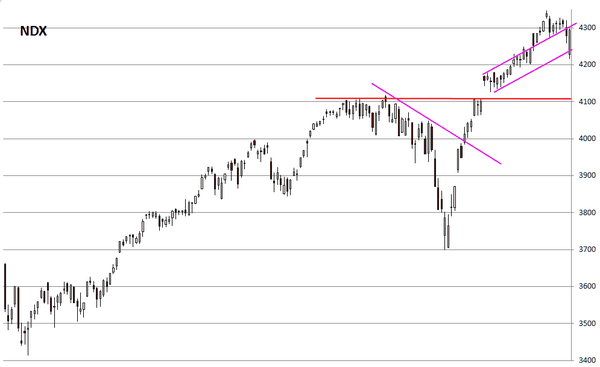
The Nasdaq 100 opened at the lower end of its uptrend channel and closed at the upper end of this uptrend channel. So, it will be very interesting to see what happens next. Break up or roll down?
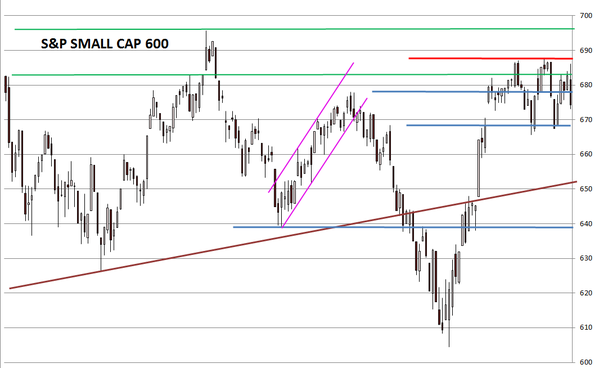
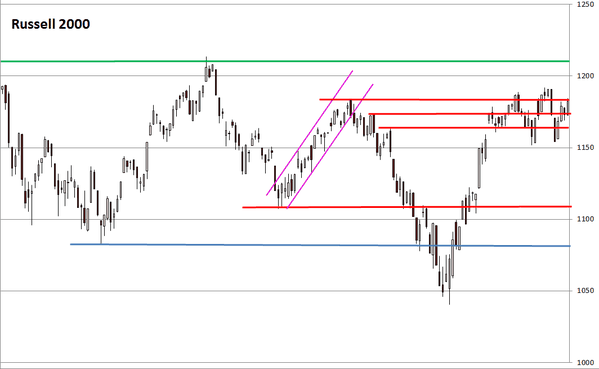
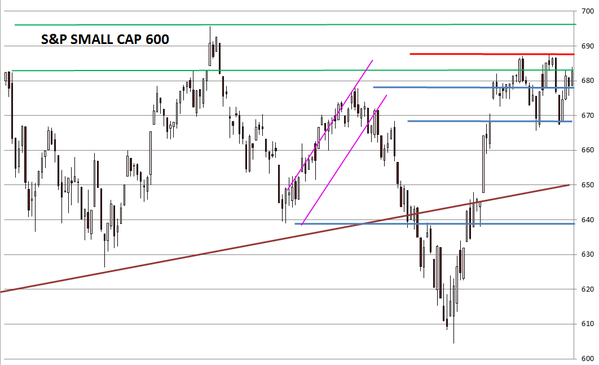
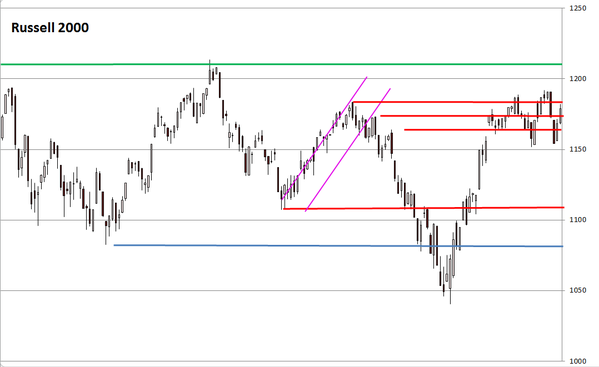
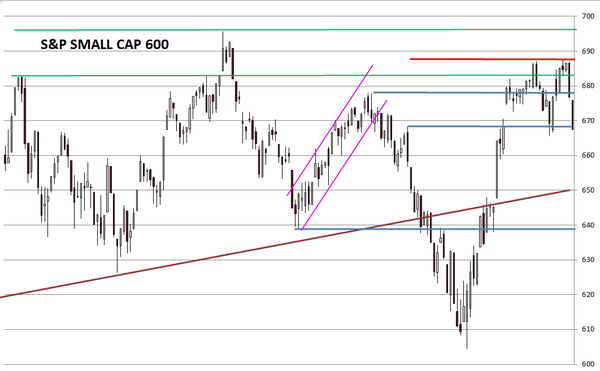
The Russell 2000 was also able to print a big white candle and the chart looks rather bullish at this stage.

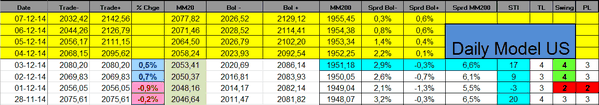
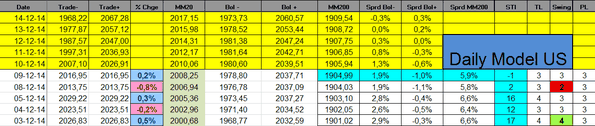
The Sigma Trend Index is slightly negative while other indicators are neutral. It is important to monitor if the trend index is able to bounce back in coming sessions.
Short Term Trading Book:
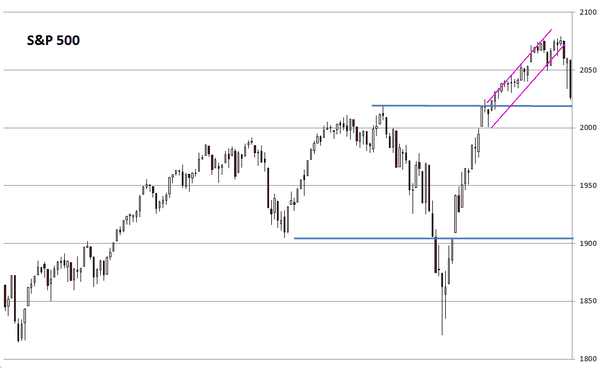
- SPX: long at 1892.65 (stop @ 1972, 3pts below the ST model to take into account bid/ask spread)
- NDX: long at 3828.03(stop @ 4019, 5pts below the ST model to take into account bid/ask spread)
- CAC: short at 4380.87(stop @ 4457, 5pts above the ST model to take into account bid/ask spread)
- EuroStoxx50: short at 3230.03(stop @ 3300, 5pts above the ST model to take into account bid/ask spread)
- DAX: short at 9924.15(stop @ 10182, 10pts above the ST model to take into account bid/ask spread)
- IBEX: short at 10663.8(stop @ 10902, 10pts above the ST model to take into account bid/ask spread)