16 octobre 2014
4
16
/10
/octobre
/2014
09:35
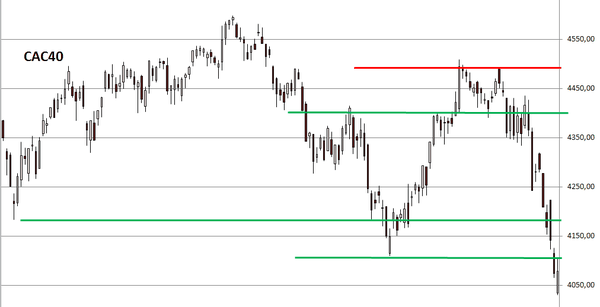
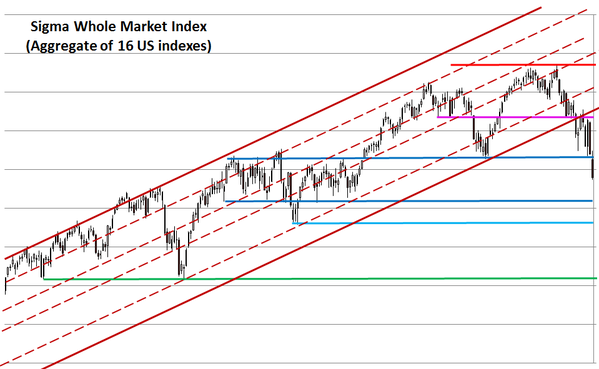
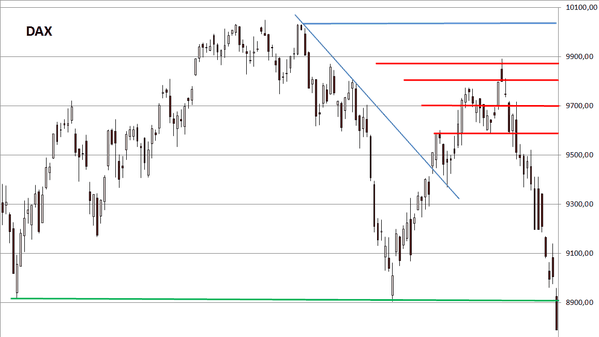
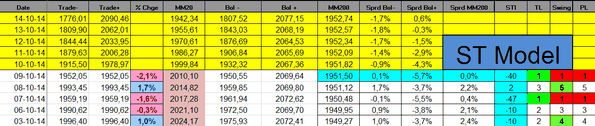
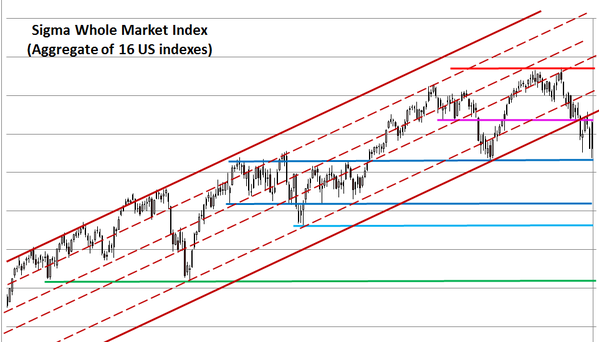
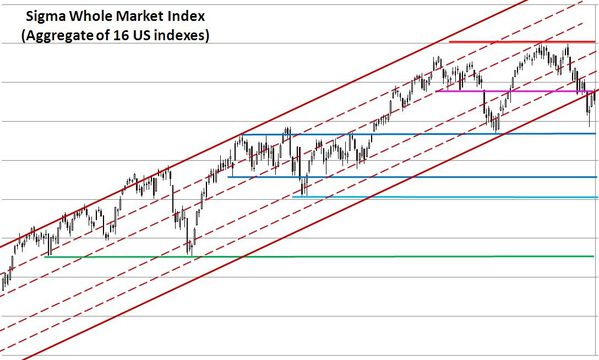
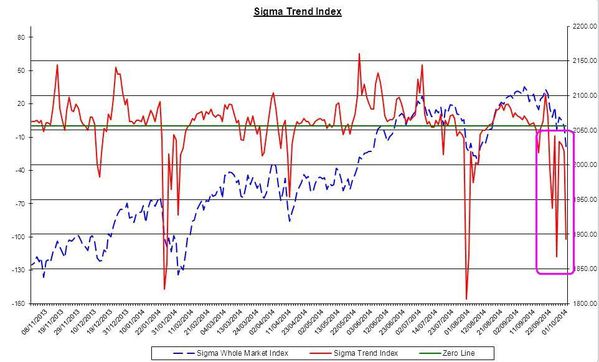
The Sigma Whole Market Index sharply declined on Wednesday and found some support on the (light bue) hrizontal support. This 'hanging man' is a bullish pattern if it is confirmed the following day. So, to be followed...
If the light blue horizontal support can't hold, the next 'natural' support is the green horizontal line.

The Sigma trend Index is once again in oversold territorybut other indicators are neutral.

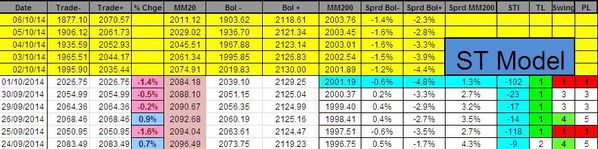
Nearly all our positions were stopped (except for the NDX): (European ones were stopped during the US session)
- SPX stopped @ 1827.81 -> 1827.81 - 1882.29 = -54.48
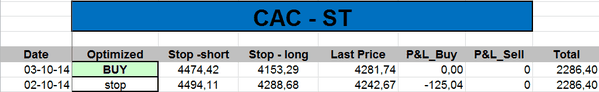
- CAC stopped @ 3690.54 -> 3590.54 - 3824.47 = -233.93
- EStoxx stopped @ 2920.67 -> 2920.67 - 3003.48 = -82.81
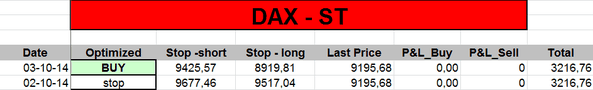
- DAX stopped @ 8447.5 -> 8447.5 - 8828.25 = -380.75
Short Term Trading Book:
- SPX: stopped
- NDX: long at 3824.47(stop @ 3691, 5pts below the ST model to take into account bid/ask spread)
- CAC: stopped
- EStox: stopped
- DAX: stopped
- IBEX: stopped
Published by sigmatradingoscillator
-
dans
Market Analysis
15 octobre 2014
3
15
/10
/octobre
/2014
09:13
The Sigma Whole Market Index found some support on the blue horizontal ine and was able to bounce back.

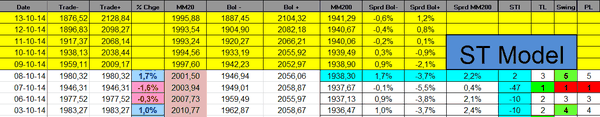
By doing so, the Swing jumped to '4' and triggered a fresh buy signal.

We are no convinved by the signal, but we implemented it in order to be in line with our quant model:


Short Term Trading Book:
- SPX: long at 1882.29 (stop @ 1828, 3pts below the ST model to take into account bid/ask spread)
- NDX: long at 3824.47(stop @ 3691, 5pts below the ST model to take into account bid/ask spread)
- CAC: long at 4090.13 (stop @ 3961, 5pts below the ST model to take into account bid/ask spread)
- EStox: long at 3003.48 (stop @ 2921, 5pts below the ST model to take into account bid/ask spread)
- DAX: long at 8828.25(stop @ 8550 10pts below the ST model to take into account bid/ask spread)
- IBEX: no position at this stage (according to our model, stop would be at 9990)
Published by sigmatradingoscillator
-
dans
Market Analysis
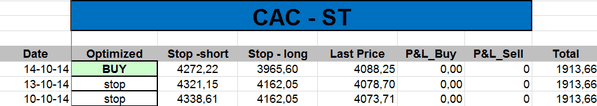
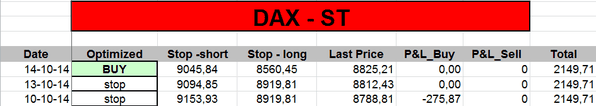
14 octobre 2014
2
14
/10
/octobre
/2014
09:16
The Sigma Whole Market Index took another big hit on Monday. It is now on a major horizontal upport. It is key to keep this level or we van get another nasty slide.

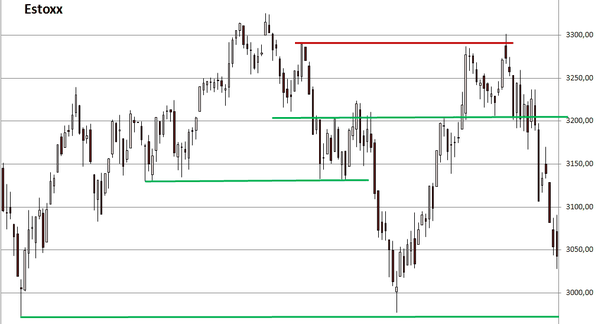
We can see the same situation on the Eurostoxx50.

Nevertheless, some other key indexes have just broken their support, so the situation remains highly dangerous.

The Sigma Trend Index remains in highly oversold territory. And the Swing at '1' is telling us the decline is highly impulsive.

We remain out of this market at this stage, and we believe this market is highly dangerous:
Short Term Trading Book:
- SPX: stopped
- NDX: stopped
- CAC: stopped
- EStox: stopped
- DAX: stopped
- IBEX: stopped
Published by sigmatradingoscillator
-
dans
Market Analysis
13 octobre 2014
1
13
/10
/octobre
/2014
10:00
The Sigma Whole Market Index declined below major supports, this is something very bearish.
The same situation can be observed on key European and US indexes:


The Sigma Trend Index sharply declined. Both the Swing and the Power Level are telling us the decline was highly impulsive.

Our long positions were stopped:
- SPX stopped at 1918.81 -> 1918.81 - 1968.4 = -49.59
- NDX stopped at 3903.95 -> 3903.95 - 4029.64 = -125.69
- DAX stopped at 8909.67 -> 8909.67 - 9264.45= -354.78
Short Term Trading Book:
- SPX: stopped
- NDX: stopped
- CAC: stopped
- EStox: stopped
- DAX: stopped
- IBEX: stopped
Published by sigmatradingoscillator
-
dans
Market Analysis
10 octobre 2014
5
10
/10
/octobre
/2014
07:00
The Sgima Whole Market Index lost its Wednesday's gain. We are once again close to the major horizontal support.

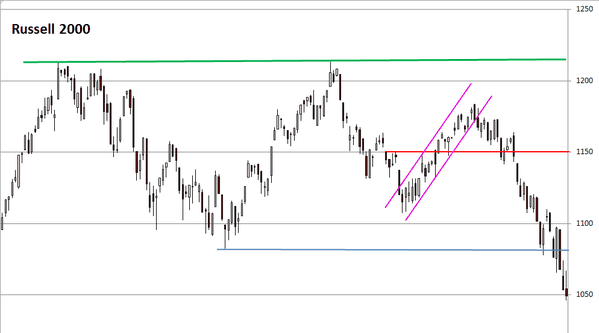
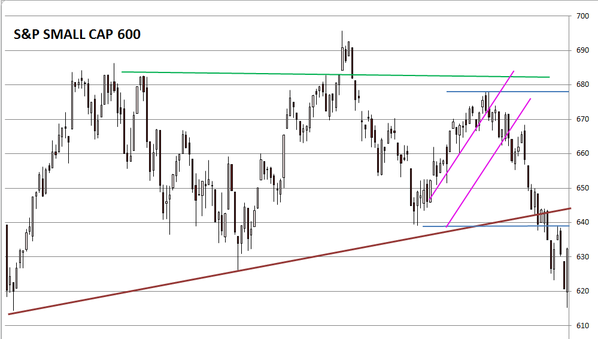
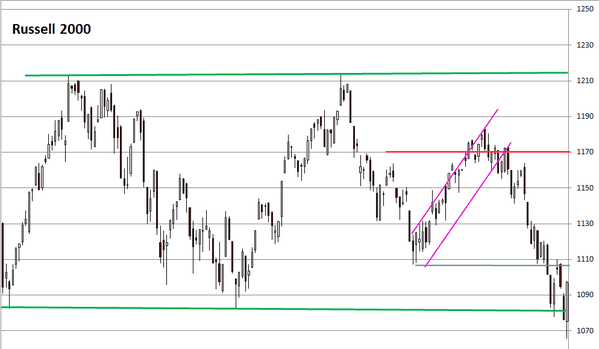
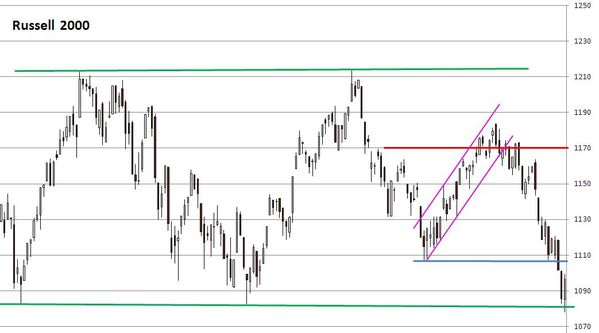
Both the Russell 2000 and the S&P Mid Cap400 closed at the low of the session. Those indexes are very close to print new lows.

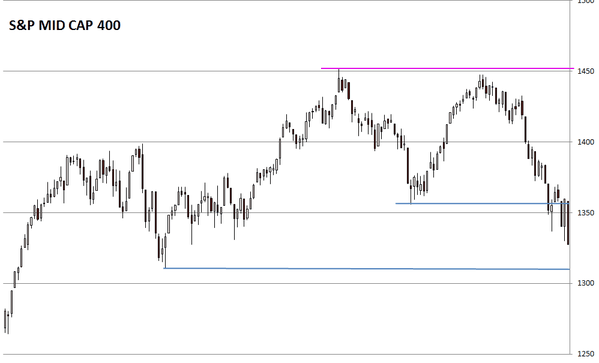
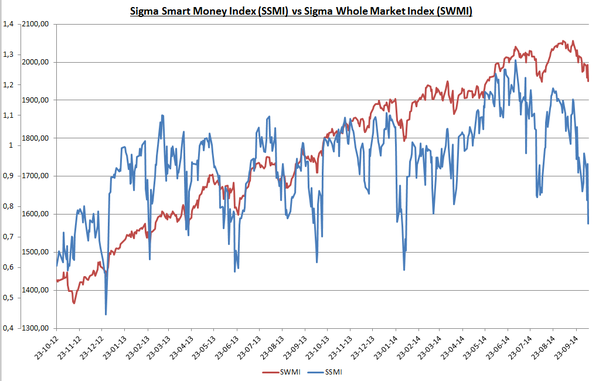
It is interesting to notice that the Sigma Smart Money Index sharply decined (blue line). This means that smart investors sharply reduced their exposure to the market.
Looking at some European indexes, we can notice we are still above last month's low.
The Sigma Trend Index fall back in negative territory and both the Swing and the Power Level are telling us we had an impulsive session.
There is no change in our positions at this stage:
Short Term Trading Book:
- SPX: long at 1968.4 (stop @ 1919, 3pts below the ST model to take into account bid/ask spread)
- NDX: long at 4029.64(stop @ 3904, 5pts below the ST model to take into account bid/ask spread)
- CAC: stopped
- EStox: stopped
- DAX: long at 9264.45(stop @ 8910 10pts below the ST model to take into account bid/ask spread)
- IBEX: stopped
Published by sigmatradingoscillator
-
dans
Market Analysis
9 octobre 2014
4
09
/10
/octobre
/2014
08:28
The Sigma Whole Market Index enjoyed a huge bounce back: from its horizontal suport to its horizontal resistance.
When we have a look at the Small Cap600 and the Russell2000, we can see 2 bullish engulfing candles. This is short term positive.
The Sigma trend Index enjoyed a huge bounce back, moving from negative territory into positive territory. Both the Swing and the Power Level came in at '5', telling us the move was highly impulsive.
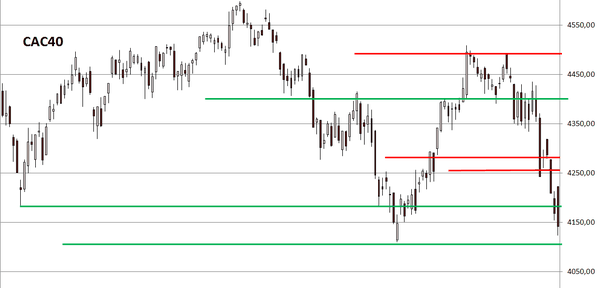
As the CAC40 declined below our stop level, our long position was stopped on this index:
- stopped at 4156.83 => 4156.83 - 4292.5 = - 135.67 (loss)
Short Term Trading Book:
- SPX: long at 1968.4 (stop @ 1919, 3pts below the ST model to take into account bid/ask spread)
- NDX: long at 4029.64(stop @ 3904, 5pts below the ST model to take into account bid/ask spread)
- CAC: stopped
- EStox: stopped
- DAX: long at 9264.45(stop @ 8910 10pts below the ST model to take into account bid/ask spread)
- IBEX: no position at this stage (according to our model, it would have been stopped)
Published by sigmatradingoscillator
-
dans
Market Analysis
7 octobre 2014
2
07
/10
/octobre
/2014
08:55
The Sigma Whole Market Index was unable to move above its pink horizontal resistance.This is not a good signal, it is very important to move above this level in coming days.
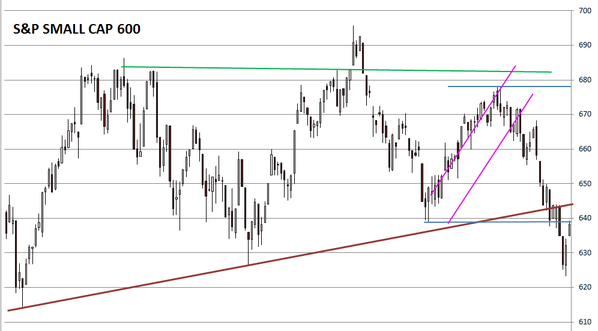
We have the same situation on the S&P Small Cap 600. This is something to monitor in coming sessions.
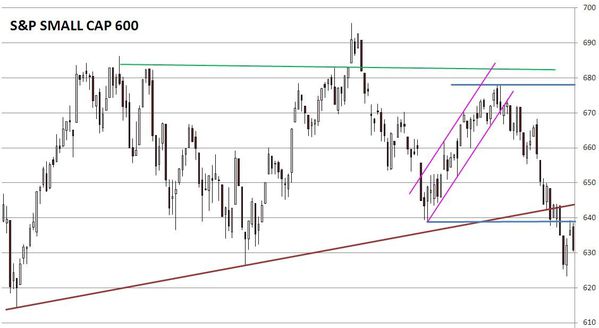
There is no new information coming from our indicators. The Sigma Trend Index remains at '-10'.

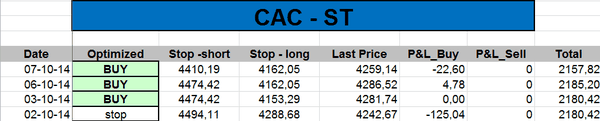
The ST model computed new stop levels on most of our positions:


Short Term Trading Book:
- SPX: long at 1968.4 (stop @ 1919, 3pts below the ST model to take into account bid/ask spread)
- NDX: long at 4029.64(stop @ 3904, 5pts below the ST model to take into account bid/ask spread)
- CAC: long at 4292.5 (stop @ 4157, 5pts below the ST model to take into account bid/ask spread)
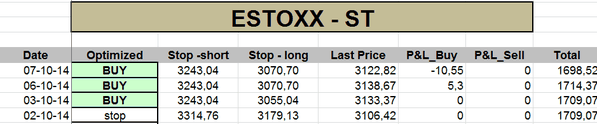
- EStox: long at 3153.48 (stop @ 3065, 5pts below the ST model to take into account bid/ask spread)
- DAX: long at 9264.45(stop @ 8910 10pts below the ST model to take into account bid/ask spread)
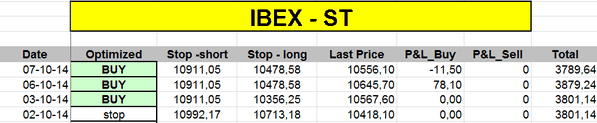
- IBEX: no position at this stage (according to our model, stop would be at 10469)
Published by sigmatradingoscillator
-
dans
Market Analysis
6 octobre 2014
1
06
/10
/octobre
/2014
07:56
The Sigma Whole Market Index had a nice session on Friday, printing a big white candle. The index is now right below the pink horizontal resistance.

Looking at other indexes, we can notice that some key indexes are close to major resistances. It will be highly important to monitor if they can move above these levels.

The Sigma Trend Index sharply bounced back and is now close to its zero line. The Swing came in at '5'. So, the ST model generated a new buy signal (for more info about our methodology, click on the link in the right column).

So, we opened some long positions 5 minutes before the US close on Friday:
- 1 NDX @ 4029.64
- 1 SPX @ 1968.4
- 1 CAC @ 4292.5
- 1 ESToxx @ 3153.48
- 1 DAX @ 9264.45


Short Term Trading Book:
- SPX: long at 1968.4 (stop @ 1916, 3pts below the ST model to take into account bid/ask spread)
- NDX: long at 4029.64(stop @ 3906, 5pts below the ST model to take into account bid/ask spread)
- CAC: long at 4292.5 (stop @ 4148, 5pts below the ST model to take into account bid/ask spread)
- EStox: long at 3153.48 (stop @ 3050, 5pts below the ST model to take into account bid/ask spread)
- DAX: long at 9264.45(stop @ 8910 10pts below the ST model to take into account bid/ask spread)
- IBEX: no position at this stage (according to our model, stop would be at 10346)
Published by sigmatradingoscillator
-
dans
Market Analysis
3 octobre 2014
5
03
/10
/octobre
/2014
06:20
The Sigma Whole MArket Index was roughly flat at the open. Then it came under heavy selling pressure during the first hours of trading. Thereafter, it was able to rally and close roughly unchanged, printing a clear hanging man.
We are not far from the horizontal support and it will be important to see what happens there if we test this level.
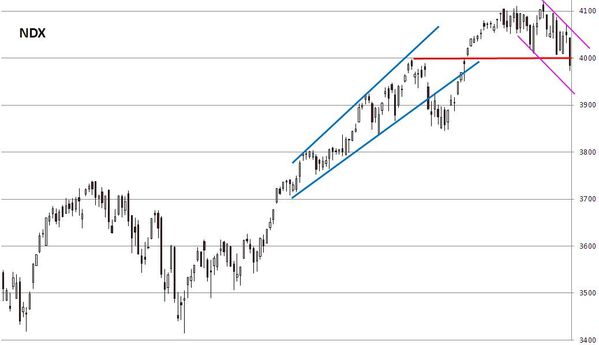
Nevertheless, we can already say that recent decline made a lot of damages because it confirmed the medium term uptrend is broken (red uptrend channel). This is (at least) short term bearish.

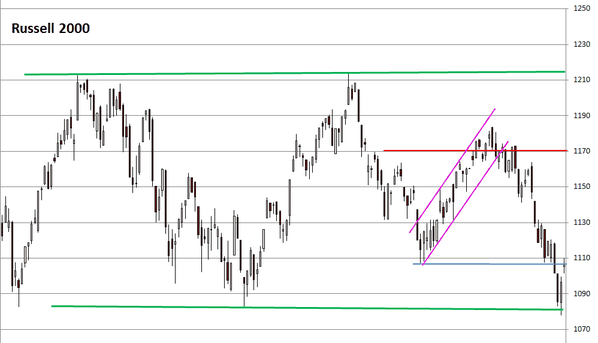
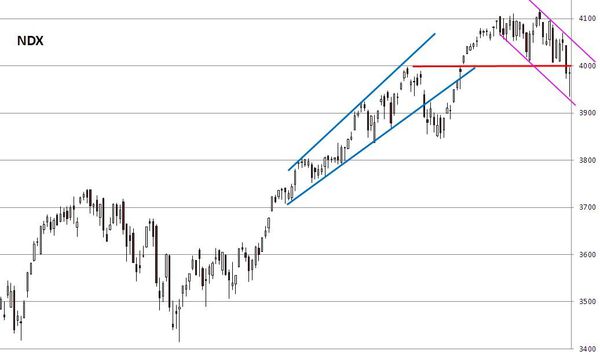
The Mid Cap 400, the Nasdaq 100 and the Russell 2000 led the rebound on Thursday. Looking at their charts, we are not surprised that they rebounded because they were on (or very close to) strong supports..

The Sigma Trend Index remains at highly oversold levels.

We had a stop on our SPX at 1926 and even if the intraday low was at 1926.03, we were stopped due to the bid/ask spread => at the lowest point of the session, always a frustration...
Spx: stopped at 1925.97 => 1925.97 - 1936.12 = -10.15 (loss)
Short Term Trading Book:
- SPX: stopped
- NDX: stopped
- CAC: stopped
- EStox: stopped
- DAX: stopped
- IBEX: stopped
Published by sigmatradingoscillator
-
dans
Market Analysis
2 octobre 2014
4
02
/10
/octobre
/2014
07:45
The Sigma Whole Market Index had a bad session on Wednesday: it broke both its uptrend channel and its horizontal support. We will monitor if the next support (blue horizontal line) is able to stop current decline.

Looking at the Russell 2000 and the Small Cap 600, we can notice that both indexes are on a major supports. If they move below their supports we will have a confirmed downtrend because we would have a lower high and a lower low.


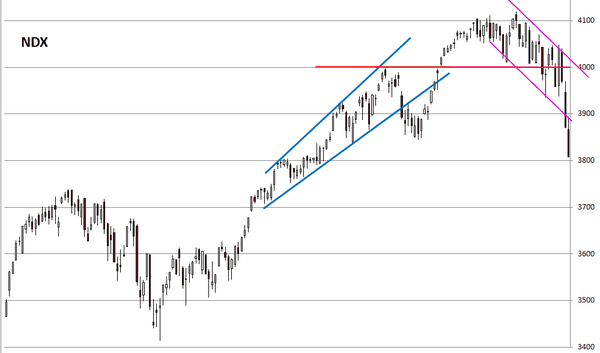
It is also important to notice that the Nasdaq 100 starts to show some signs of weakness.
Looking at our indicators, the Sigma Trend Index is in oversold territory. This is the first time in 2 years it stays at such depressed levels for more than a few sessions.This could be the early signs of a major trend reversal
Both the Swing and the Power Level (PL) came in at '1', telling us the decline was highly impulsive.
As the NDX declined below our stop level, our long position was stopped and we booked our gains:
- NDX stopped at 3998.63 => 3998.63 - 3894.96 = 103.67
Short Term Trading Book:
- SPX: long at 1936.12 (stop @ 1926, 3pts below the ST model to take into account bid/ask spread)
- NDX: stopped
- CAC: stopped
- EStox: stopped
- DAX: stopped
- IBEX: stopped
Published by sigmatradingoscillator
-
dans
Market Analysis


