Overblog
Suivre ce blog Administration + Créer mon blog
6 décembre 2013 5 06 /12 /décembre /2013 07:54

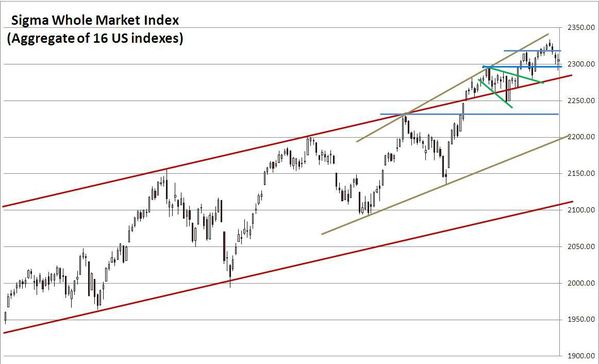
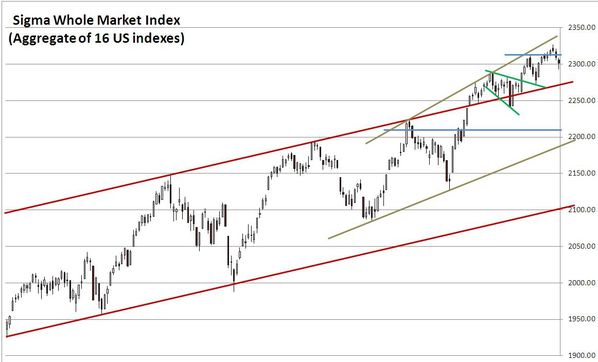
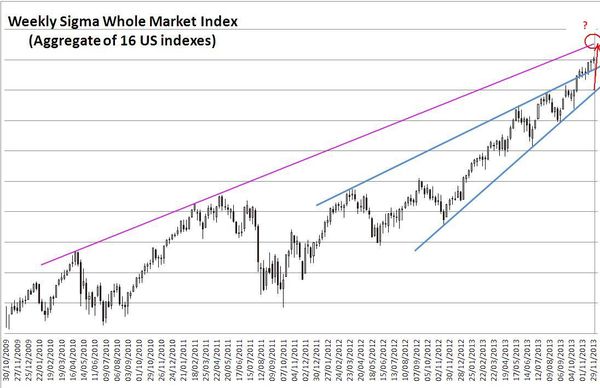
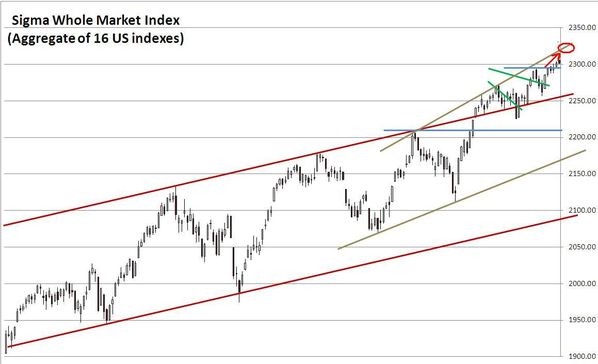
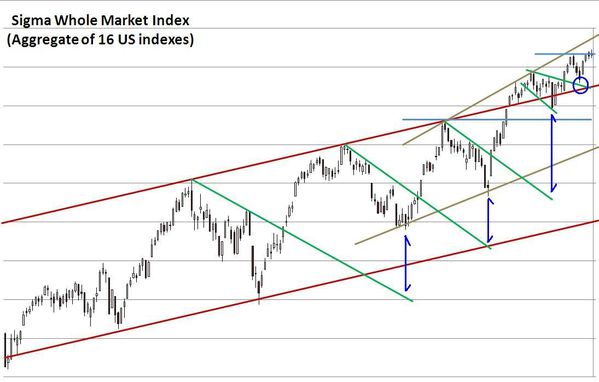
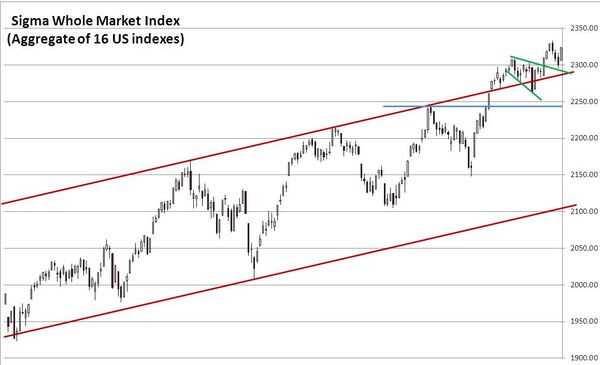
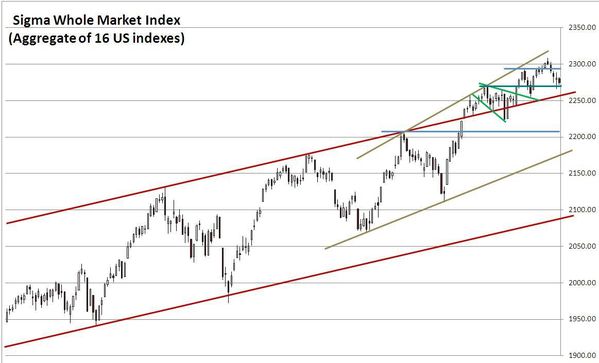
The Sgima Whole Market Index printed an inside day on Thursday and this market doesn't give any warning sign at this time. So impressive. Thursday's session was an inside day and we are close to a major (horizontal) support.

Once again, everything will depend on 'one number' (payrolls). Be ready for high volatility on Friday.


usmarket20131205.JPG


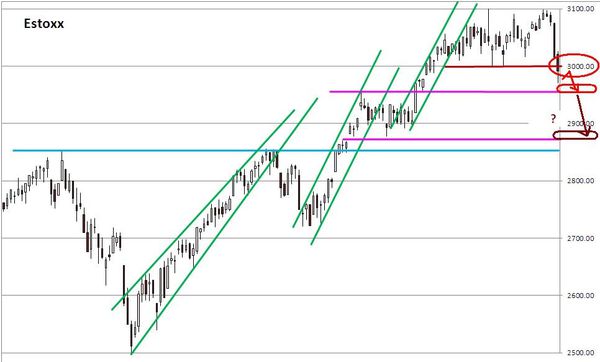
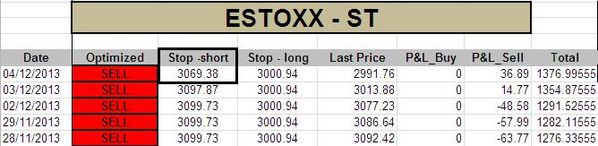
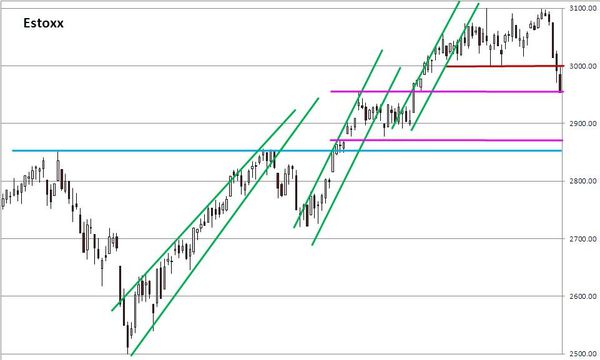
Looking at the EuroStoxx, the market slightly rebounded in early session on Thursday. Thereafter, it declined on a straight line to its next horizontal support. If this support doesn't hold on, the next target is 2870.


chartestox20131205.JPG

chartcac20131205.JPG


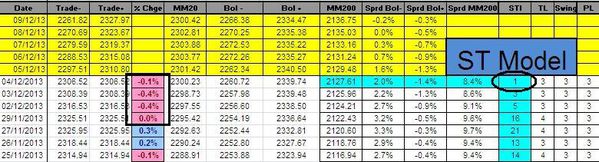
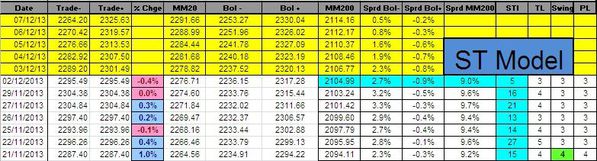
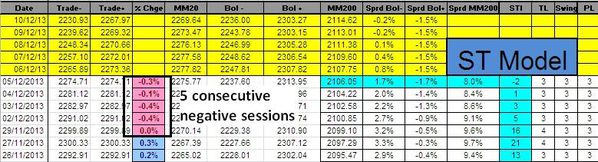
Looking at our indicators, the Sigma Trend Index slightly declined below its zero line. Other indicators remain neutral at '3'. It is interesting to notice the market closed in negative territory for its 5th consecutive session but each decline was very limited. So, we can't say there is any impulse at this time.


stmodel20131205.JPG


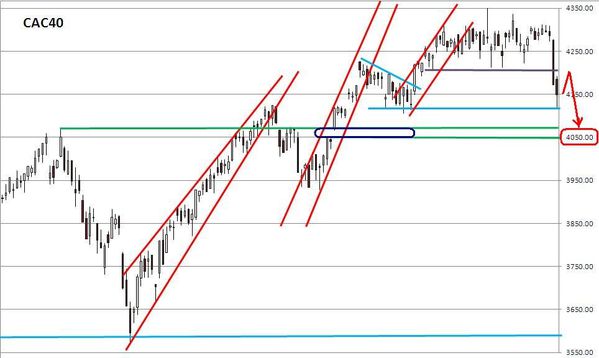
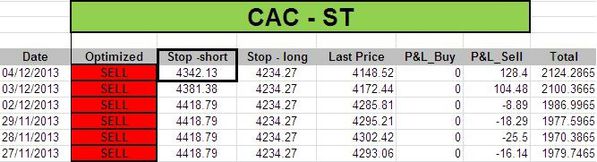
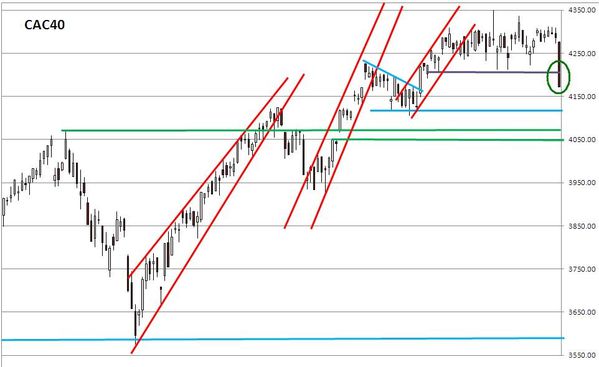
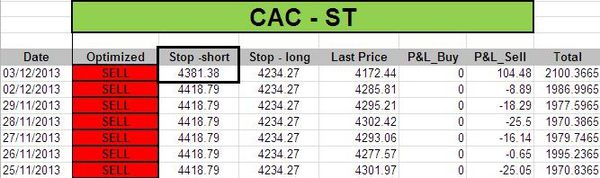
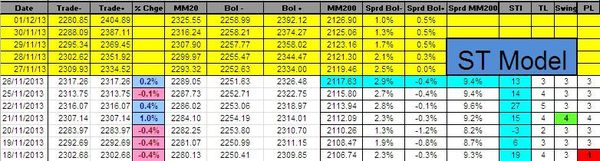
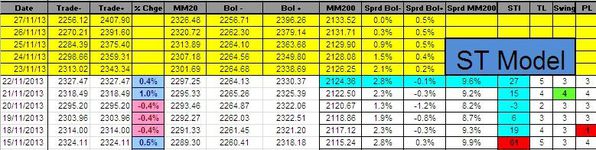
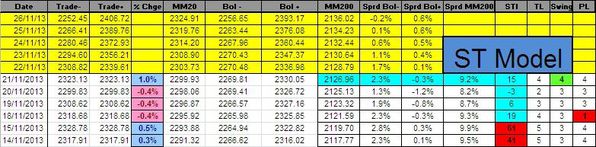
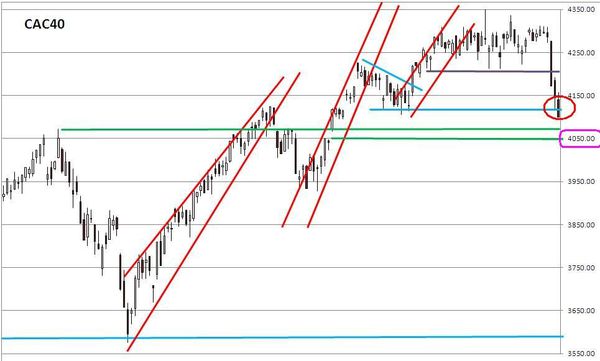
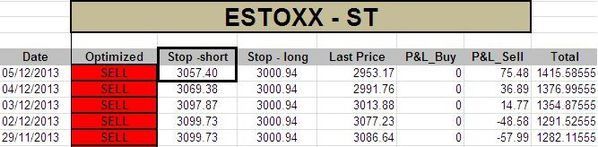
The ST model computed new stop levels for both the CAC and the EuroStoxx.


stcac20131205.JPG

stestox20131205.JPG


Short Term Trading Book:


- SPX: short at 1792.26 (stop @ 1827, 3pts above the ST model to take into account bid/ask spread)

- NDX: stopped

- CAC: short at 4272.14 (stop @ 4332, 5pts above the ST model to take into account bid/ask spread)
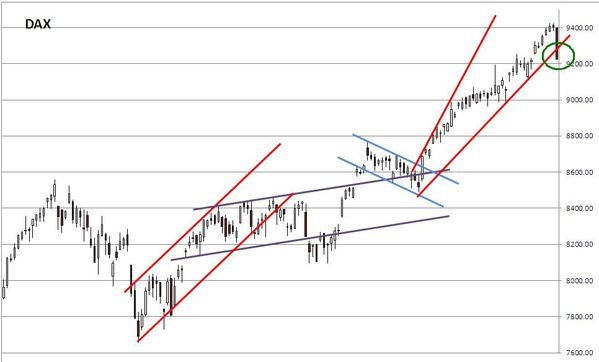
- DAX: stopped

- EStoxx: short at 3027.17 (stop @ 3062, 5pts above the ST model to take into account bid/ask spread)


Medium Term Trading Book:


- No more medium term position at this stage.


Out of model position:


- 1 call NDX January 2014 strike 3700 @ 5.06

Partager cet article
Repost0
5 décembre 2013 4 05 /12 /décembre /2013 08:48

The Sigma Whole Market Index is very resilient and it was able to print a 'doji' on Wednesday. The recent outperformance of US market relative to Europe is amazing. There is no sign of decline in US at this stage. Current decline looks like a consolidation because there is no impulse and major supports remain in place.


usmarket20131204.JPG


In Europe, the situation is rather different. The Eurostoxx 50 broke its major support at 3000 and the CAC40 declined on a straight line to its first strong horizontal support at 4120. European market is so oversold that we are probably close to a short term rebound. Thereafter, we believe the decline will resume in order to fill some open gaps at lower levels.


chartestox20131204.JPG

chartcac20131204.JPG


The Sigma trend Index is at '1', so the market is currently testing its uptrend. Other indicators are at '3' (= neutral) which tells us there is no specific momentum at this stage (this confirms our chart analysis). Nevertheless, it is interesting to notice the market closed for the 4th consecutive session in negative territory, there is a long time that hasn't happened.


stmodel20131204.JPG


The ST model computed new stop levels on both the CAC40 and the Eurostoxx50:


stcac20131204b.JPG

stestox20131204.JPG


Short Term Trading Book:


- SPX: short at 1792.26 (stop @ 1827, 3pts above the ST model to take into account bid/ask spread)

- NDX: stopped

- CAC: short at 4272.14 (stop @ 4347, 5pts above the ST model to take into account bid/ask spread)

- DAX: stopped

- EStoxx: short at 3027.17 (stop @ 3074, 5pts above the ST model to take into account bid/ask spread)


Medium Term Trading Book:


- No more medium term position at this stage.


Out of model position:


- 1 call NDX January 2014 strike 3700 @ 5.06

Partager cet article
Repost0
4 décembre 2013 3 04 /12 /décembre /2013 09:59

Today, we want to start our charts review with Europe. Tuesday's session made a lot of damages to the EuroStoxx and the CAC. The Dax also broke an important uptrend but its momentum remains strong.

Once again, the CAC looks like the weakest one, and the perfect candidate to short.


chartcac20131203.JPG

chartestox20131203.JPG

chartdax20131203.JPG


Looking at the Sigma Whole Market Index, we can notice current decline is very modest and looks more like a consolidation rather than the start of a decline. There is no sign of (negative) impulse at this time.


usmarket20131203.JPG


But the Sigma Smart Money Index continues to deteriorate much faster than the Sigma Whole Market Index, telling us smart investors are reducing their exposure to the market.


ssmi20131203.JPG


Looking at our indicators, the Sigma trend Index is at '3', other indicators are neutral. It is interesting to notice that we got 2 sets of 3 consecutive negative sessions in a very short time. That hasn't occured for a long time and could be the first sign of a weakening market.


stmodel20131203.JPG


The ST model computed new stop levels for both the CAC and the Eurostoxx:


stcac20131204.JPG

stestox20131203


Short Term Trading Book:


- SPX: short at 1792.26 (stop @ 1827, 3pts above the ST model to take into account bid/ask spread)

- NDX: stopped

- CAC: short at 4272.14 (stop @ 4385, 5pts above the ST model to take into account bid/ask spread)

- DAX: stopped

- EStoxx: short at 3027.17 (stop @ 3103, 5pts above the ST model to take into account bid/ask spread)


Medium Term Trading Book:


- No more medium term position at this stage.


Out of model position:


- 1 call NDX January 2014 strike 3700 @ 5.06

Partager cet article
Repost0
3 décembre 2013 2 03 /12 /décembre /2013 09:24

The Sigma Whole Market Index declined slightly on Monday. We have a complete upleg at this stage (5 clear subwaves) but there is no indication of reversal at this stage. Still need some confirmation.


usmarket20131202.JPG


The negative divergence between the Sigma Smart Money Index and the Sigma Whole Market Index is intact (lower highs for the SSMI and higher highs for the SWMI). This doesn't tell us we will decline right now, but this is one more warning signal.


ssmi20131202.JPG


Looking at our indicators, there is no major change. The Sigma Trend Index is close to its zero line (at '5') while other indicators are neutral at '3'.


stmodel20131202.JPG


There is no change in our trading book.


Short Term Trading Book:


- SPX: short at 1792.26 (stop @ 1827, 3pts above the ST model to take into account bid/ask spread)

- NDX: stopped

- CAC: short at 4272.14 (stop @ 4423, 5pts above the ST model to take into account bid/ask spread)

- DAX: stopped

- EStoxx: short at 3027.17 (stop @ 3105, 5pts above the ST model to take into account bid/ask spread)


Medium Term Trading Book:


- No more medium term position at this stage.


Out of model position:


- 1 call NDX January 2014 strike 3700 @ 5.06

Partager cet article
Repost0
1 décembre 2013 7 01 /12 /décembre /2013 21:22

The Sigma Whole Market Index continues to climb, day after day, week after week. I knwo a lot of investors don't share my opinion, but for me there is no doubt, we are in the late stage of a bubble powered by the Fed easy money policy and this will end very badly. How long can it last before we reach the top? I really don't know. But at this stage in the bubble, we will probably continue to accelerate in an asymptotic move until we hit the wall like we did in 2000 (for those of you interested in this subject, I added a youtube's link in Thursday's daily comments).


We can notice on the Sigma Whole Market index (weekly) chart that we are not far from an important resistance (pink line, =~2.5% upside from current levels). It will be interesting to see if this level act as a resistance (at least short term) or if the market continues to accelerate when it reaches this level.


usmarketw20131129.JPG


Looking at the Sigma Smart Money Index (blue line), it is interesting to notice that current top remains below 2007's top. So, the negative divergences between the Sigma Whole Market Index and the Sigma Smart Money Index are very important because we have divegences on both short term and medium term.


Sigma Smart Money Index = log (Sigma Whole Market Index / Vix ^2)


ssmiw20131129.JPG


Looking at the Sigma Whole Market Index on a daily basis, the situation is rougly the same than on the weekly chart; the next resistance is roughly 2% above Friday's close. Looking at the chart, it is clear we are in an acceleration phase: trend channel are steeper and steeper. We wouldn't be surprised to see further acceleration in the short momentum.


usmarket20131129.JPG


The end of last week made a lot of damages in our book: we were stop on 2 short positions (NDX & DAX). We want to continue to test our model (even in a bubble period) but at this time we are close to roll in negative P&L for H2. In this context, we decided to cover our book against a bubble blow off  by buying a  January Call on the NDX (strike 3700) @ 5.06.


NDX: 1 short @ 3361.01, stopped @ 3475.13 => -144.12 pts (loss)

DAX: 1 short @ 9193.36, Stopped @ 9379.17 => -185.81 pts (loss)


As we hit several stops in recent weeks, we believe it is interesting to summarize our P&L since we started to test current model (in early may 2013). To make it simple, we are booking big gains on both the CAC & NDX, we are roughly flat on both the SPX & EuroStoxx and we have big losses on the DAX.


pandllcacdax20131129.JPG

pandlestxspx20131129.JPG

pandlspxndx20131129.JPG


Short Term Trading Book:


- SPX: short at 1792.26 (stop @ 1827, 3pts above the ST model to take into account bid/ask spread)

- NDX: stopped

- CAC: short at 4272.14 (stop @ 4423, 5pts above the ST model to take into account bid/ask spread)

- DAX: stopped

- EStoxx: short at 3027.17 (stop @ 3105, 5pts above the ST model to take into account bid/ask spread)


Medium Term Trading Book:


- No more medium term position at this stage.


Out of model position:


- 1 call NDX January 2014 strike 3700 @ 5.06

Partager cet article
Repost0
28 novembre 2013 4 28 /11 /novembre /2013 17:04

It is very impressive to see the market going up day after day without any real sign of pullback. It seems we are in a blow off top situation, and in this situation our model is worthless.


This presentation from D. Sornette on bubbles and blow off tops is very interesting: http://www.youtube.com/watch?v=C_eFjLZqXt8 .


USmarket20131127.JPG


There is no new information in our indicators:


stmodel20131127.JPG


We are very close to some stops. This rally is eating most of the profits we generated this year.


Short Term Trading Book:


- SPX: short at 1792.26 (stop @ 1827, 3pts above the ST model to take into account bid/ask spread)

- NDX: short at 3361.01 (stop @ 3475, 5pts above the ST model to take into account bid/ask spread)

- CAC: short at 4272.14 (stop @ 4423, 5pts above the ST model to take into account bid/ask spread)

- DAX: short at 9193.36 (stop @ 9379, 10pts above the ST model to take into account bid/ask spread)

- EStoxx: short at 3027.17 (stop @ 3105, 5pts above the ST model to take into account bid/ask spread)


Medium Term Trading Book:


- No more medium term position at this stage.

Partager cet article
Repost0
27 novembre 2013 3 27 /11 /novembre /2013 06:51

Two days ago we wrote:


"...The market is so strong we don't believe in the double top scenario at this stage. So, we believe an extansion to 1.618x wave one is possible. => it remains 0.8% upside in this scenario. This would imply a target around 1818 for the SPX and 3449 for the NDX...."


On Wednesday, the NDX reached our target but the SPX didn't. Nevertheless, the "reversal" we had in the last hour of trading is rather interesting. If we get some follow up of this reversal in the next two sessions, a ST top will be confirmed. 

It is also interesting to notice that in previous uplegs, when we got a breakout of the green downtrends, the market didn't retest those trendlines. In the last upleg, the market retested this resistance. Is it the sign the market is weakening, we will get the answer in coming days.


usmarket20131126.JPG


The negative divergence between the Sigma Whole Market Index and the Sigma Smart Money Index is still in place.


ssmi20131126.JPG


There is no change in our indicators.


stmodel20131126.JPG


Short Term Trading Book:


- SPX: 1 short at 1792.26 (stop @ 1827, 3pts above the ST model to take into account bid/ask spread)

- NDX: 1 short at 3361.01 (stop @ 3475, 5pts above the ST model to take into account bid/ask spread)

- CAC: 1 short at 4272.14 (stop @ 4423, 5pts above the ST model to take into account bid/ask spread)

- DAX:  1 short at 9193.36 (stop @ 9379, 10pts above the ST model to take into account bid/ask spread)

- EStoxx: 1 short at 3027.17 (stop @ 3105, 5pts above the ST model to take into account bid/ask spread)


Medium Term Trading Book:


- No more medium term position at this stage.

Partager cet article
Repost0
26 novembre 2013 2 26 /11 /novembre /2013 07:46

We got a new (marginal) high on the Sigma Whole Market Index. So, current upleg could have exhausted (with 5 clear waves). Nevertheless Monday's 'reversal' was absolutely not convincing. In this context, we can't say (at this stage) the top is in.


usmarket20131125.JPG


There is no change in our indicators:


stmodel20131125.JPG


Short Term Trading Book:


- SPX: 1 short at 1792.26 (stop @ 1827, 3pts above the ST model to take into account bid/ask spread)

- NDX: 1 short at 3361.01 (stop @ 3475, 5pts above the ST model to take into account bid/ask spread)

- CAC: 1 short at 4272.14 (stop @ 4423, 5pts above the ST model to take into account bid/ask spread)

- DAX:  1 short at 9193.36 (stop @ 9379, 10pts above the ST model to take into account bid/ask spread)

- EStoxx: 1 short at 3027.17 (stop @ 3105, 5pts above the ST model to take into account bid/ask spread)


Medium Term Trading Book:


- No more medium term position at this stage.

Partager cet article
Repost0
24 novembre 2013 7 24 /11 /novembre /2013 11:28

When we look at the chart of the Sigma Whole Market Index, we can easily identify a 5 waves pattern in current up leg (pink lines). For the time being, the 5th wave is still below the top of the 3rd wave and current length is 32pts for the 1st wave and 31pts for the 5th wave.

The market is so strong we don't believe in the double top scenario at this stage. So, we believe an extansion to 1.618x wave one is possible. => it remains 0.8% upside in this scenario. This would imply a target around 1818 for the SPX and 3449 for the NDX.


usmarket20131122.JPG


The Sigma trend Index rose to 27, other indicators are neutral (at '3'):


stmodel20131122.JPG


Short Term Trading Book:


- SPX: 1 short at 1792.26 (stop @ 1827, 3pts above the ST model to take into account bid/ask spread)

- NDX: 1 short at 3361.01 (stop @ 3475, 5pts above the ST model to take into account bid/ask spread)

- CAC: 1 short at 4272.14 (stop @ 4423, 5pts above the ST model to take into account bid/ask spread)

- DAX:  1 short at 9193.36 (stop @ 9379, 10pts above the ST model to take into account bid/ask spread)

- EStoxx: 1 short at 3027.17 (stop @ 3105, 5pts above the ST model to take into account bid/ask spread)


Medium Term Trading Book:


- No more medium term position at this stage.

Partager cet article
Repost0
22 novembre 2013 5 22 /11 /novembre /2013 07:51

Yesterday we wrote: " ...On a pure Elliott Wave basis, there is some overlap (but very limited) between mini-4 and mini-1 => the upleg should be over. Nevertheless, it would be smart to wait for a close below the pink horizontal line in order to confirm the reversal...."


AS the market enjoyed a strong rally on Thursday, it seems the fifth (and last) wave of current upleg is underway. Usually, there is a Fibonacci multiple between the size of subwave 1 and subwave 5. Two important multiples are 1x or 1.618x the size of wave 1 for wave 5.

A 1x multiple would mean a lower high, so we believe a 1.618x multiple is more probable (~ 1% upside relative to Thursday's close). If we are right, this move should occur very quickly (because the 5th wave is an exhaustion one).


usmarket20131121.JPG


When we look at our indicators, the Swing move at '4', telling us Thursday's session was impulsive.


stmodel20131121.JPG


The ST model lowered some stop levels in Europe:


stcac20131121.JPG

stdax20131121.JPG

stestox20131121.JPG


Short Term Trading Book:


- SPX: 1 short at 1792.26 (stop @ 1827, 3pts above the ST model to take into account bid/ask spread)

- NDX: 1 short at 3361.01 (stop @ 3475, 5pts above the ST model to take into account bid/ask spread)

- CAC: 1 short at 4272.14 (stop @ 4423, 5pts above the ST model to take into account bid/ask spread)

- DAX:  1 short at 9193.36 (stop @ 9379, 10pts above the ST model to take into account bid/ask spread)

- EStoxx: 1 short at 3027.17 (stop @ 3105, 5pts above the ST model to take into account bid/ask spread)


Medium Term Trading Book:


- No more medium term position at this stage.

Partager cet article
Repost0

Presentation

  • : Le blog de sigmatradingoscillator
  • : Professionnel de la finance de marché depuis plus de 10ans, j'ai mis au point une série d'outils de trading me permettant de prendre et couper mes positions. Ici, j'écris un update quotidien sur la situation du CAC,DAX, Eurostoxx, SP500, Nasdaq100. Attention Les éléments repris dans ce blog représentent uniquement mon opinion personnelle et ne constituent en aucun cas une incitation au trading ou du conseil financier. Pour du conseil, consultez votre conseiller en placement
  • Contact

Disclaimer

NO MATERIAL HERE CONSTITUTES "INVESTMENT ADVICE" NOR IS IT A RECOMMENDATION TO BUY OR SELL ANY FINANCIAL INSTRUMENT, INCLUDING BUT NOT LIMITED TO STOCKS, COMMODITIES, OPTIONS, BONDS, FUTURES, OR BULLION. ACTIONS YOU UNDERTAKE AS A CONSEQUENCE OF OUR ANALYSIS, OPINION OR ADVERTISEMENT ON THIS SITE ARE YOUR SOLE RESPONSIBILITY.

FOR INVESTMENT ADVICE, PLAN A MEETING WITH A FINANCIAL ADVISOR IN ORDER TO ESTABLISH YOUR OWN RISK PROFILE.

Archives

Pages