Overblog
Suivre ce blog Administration + Créer mon blog
14 janvier 2015 3 14 /01 /janvier /2015 08:39
Europe:

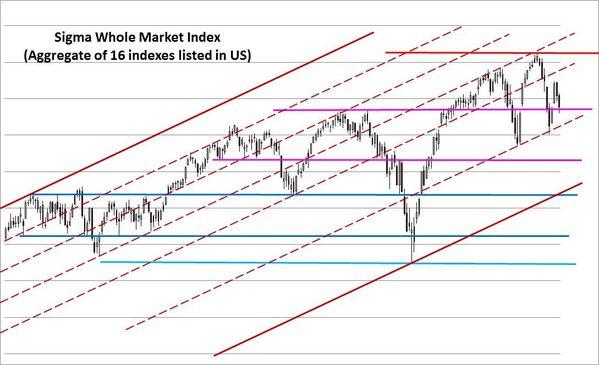
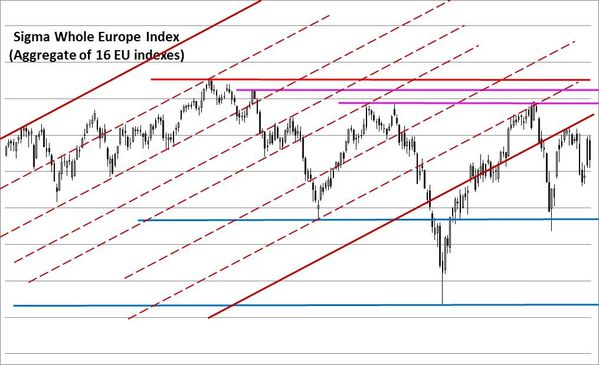
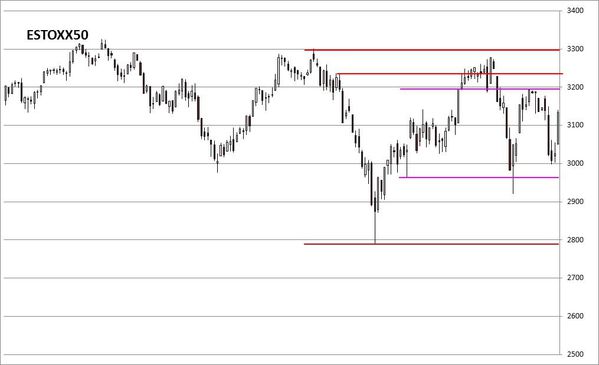
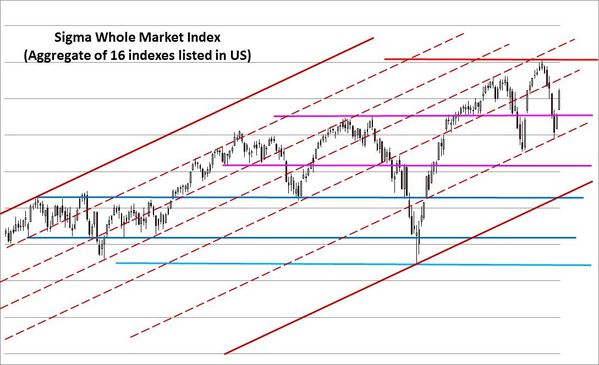
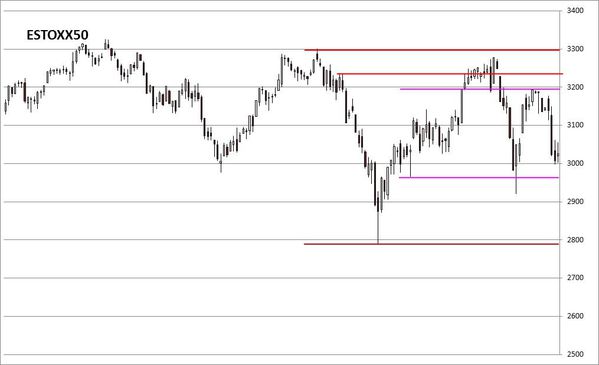
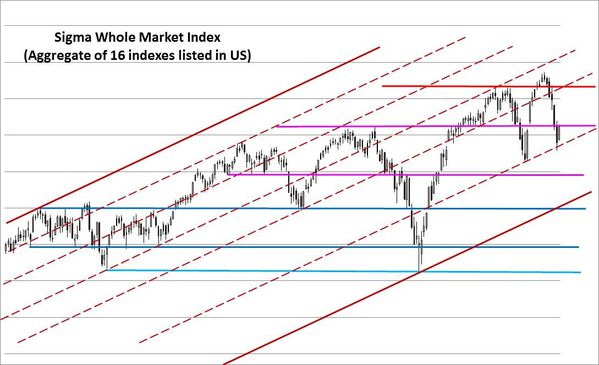
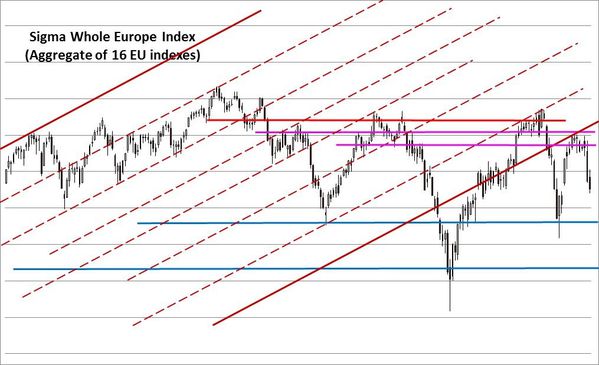
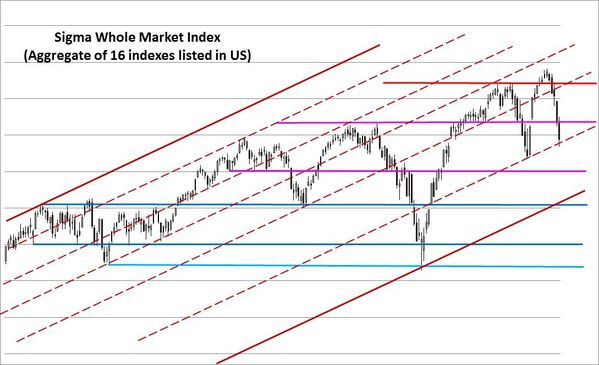
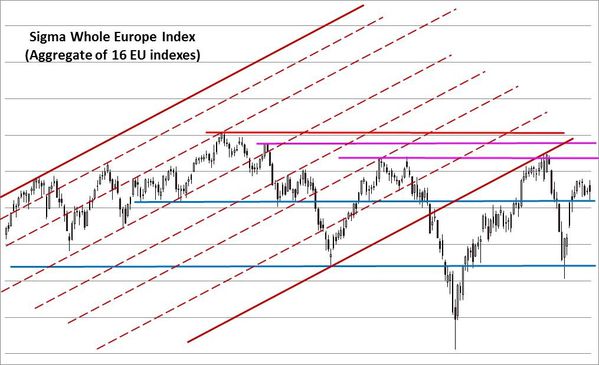
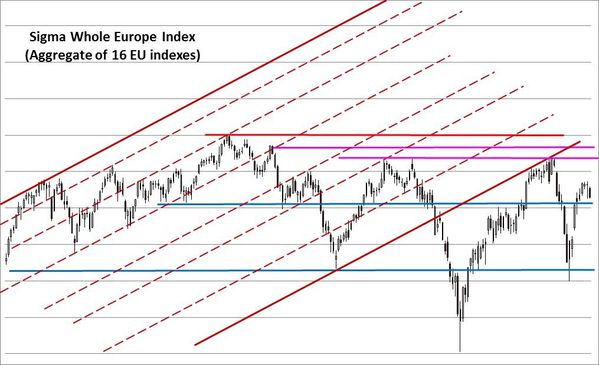
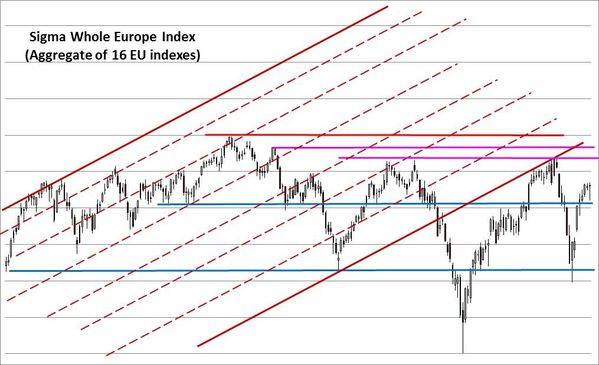
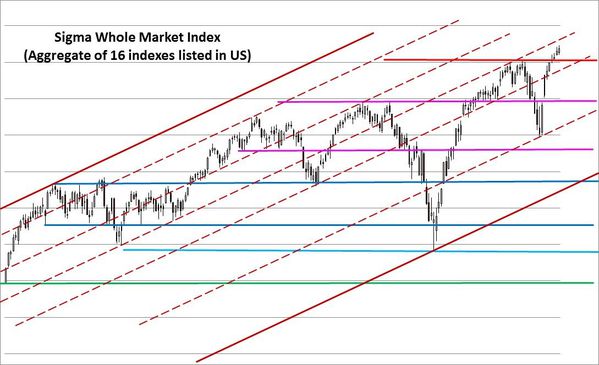
  The Sigma Whole Market Index enjoyed another strong session on Tuesday. The market is close to retest the red dotted ascending line (by the south). Nevertheless, we can't turn positive on the European market as long as it remains below the pink horizontal resistances.


EU-Daily-Chart_SWEU_20150114.jpg


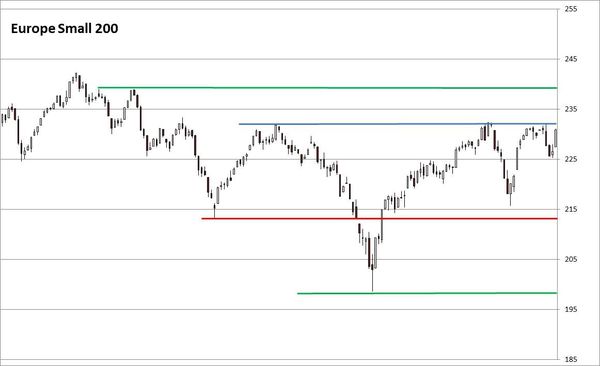
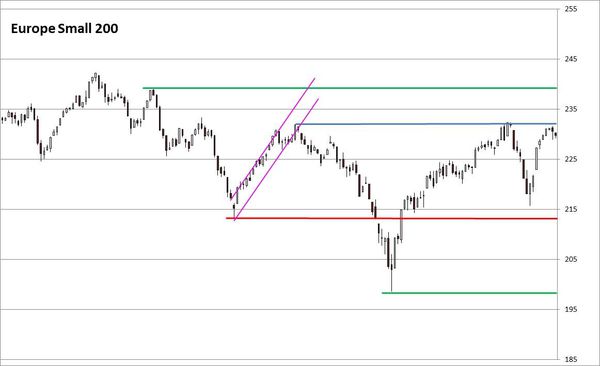
  It is also interesting to notice that both the SMI and the Europe Small Cap 200 were able to move above key resistances. Is it an early sign for the broad European market?


EU-Daily-ChartSMI_20150114.jpg


EU-Daily-ChartEUSMALL200_20150114.jpg


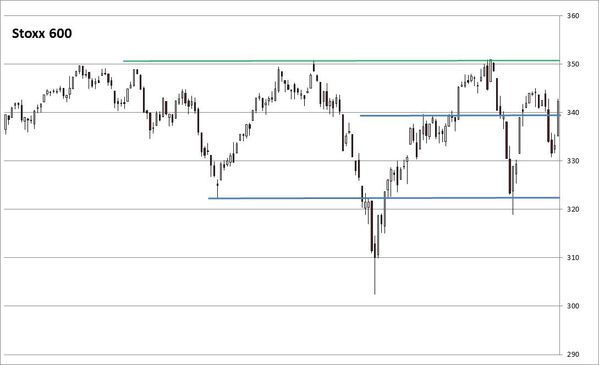
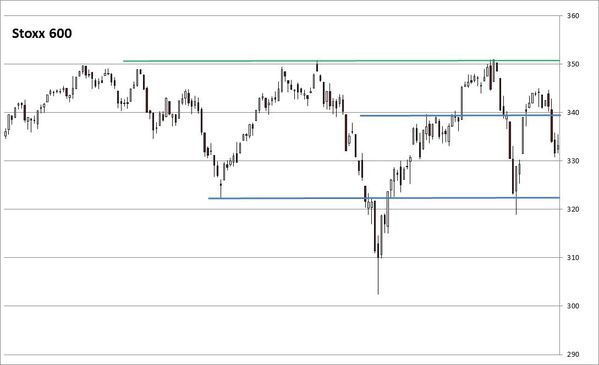
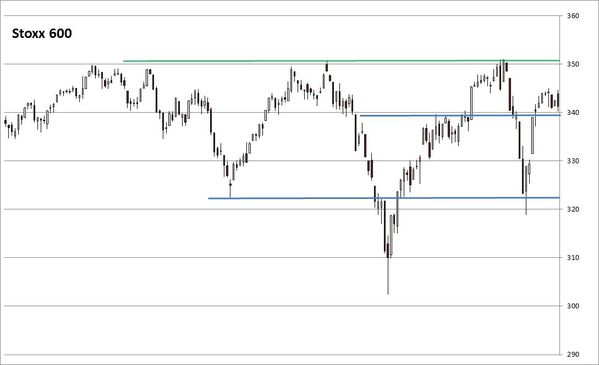
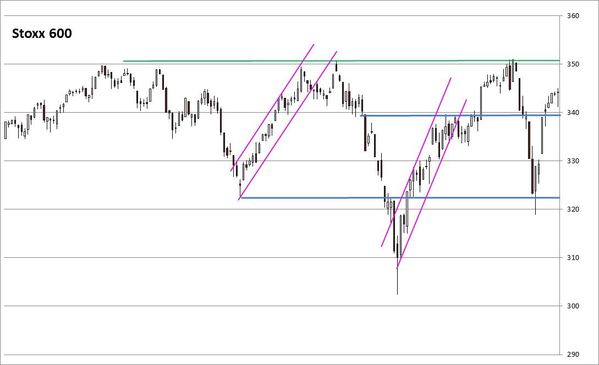
In the case of the Stoxx600, the situation remains neutral (for now).


EU-Daily-ChartSTOXX600_20150114.jpg


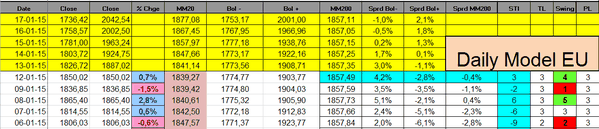
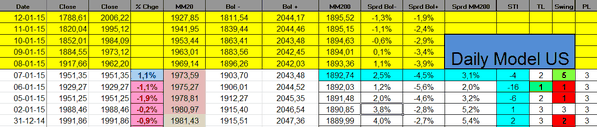
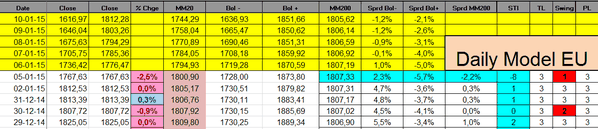
The Sigma Trend Index jumped to '13' and the Swing came in at '5' telling us the session was highly impulsive. It seems that more and more investors are betting on the January ECB's meeting .


steumodel20150113.PNG


United States:

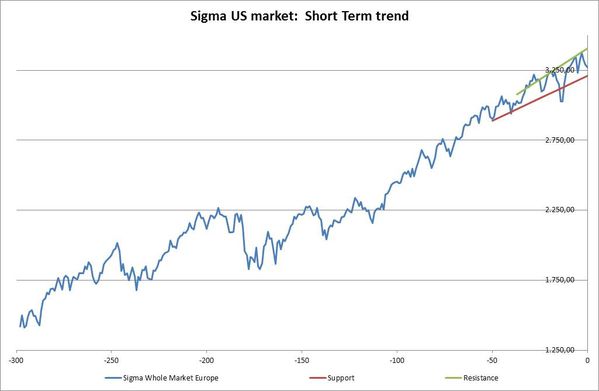
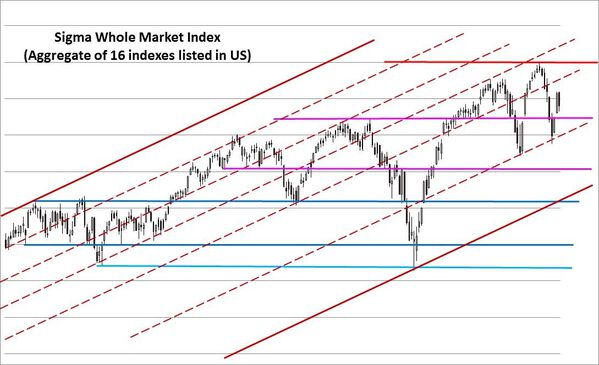
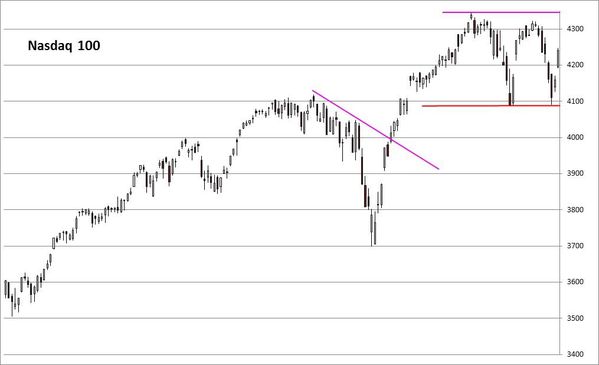
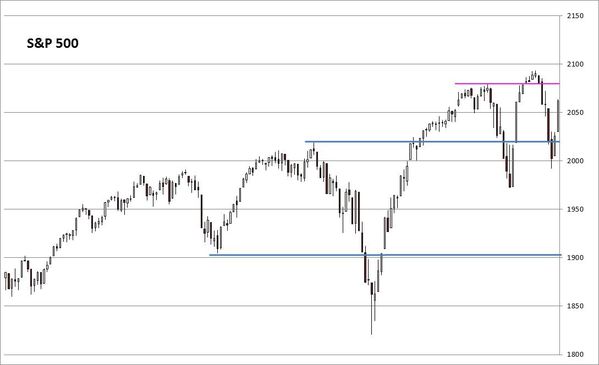
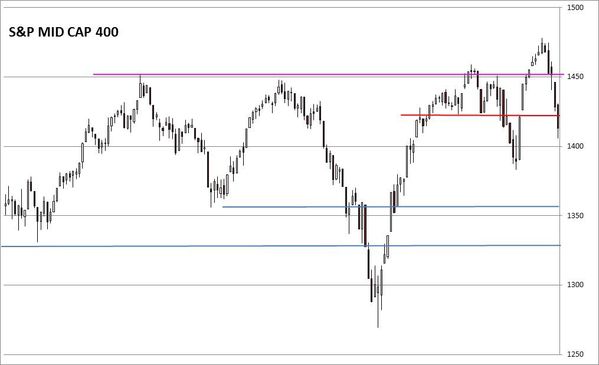
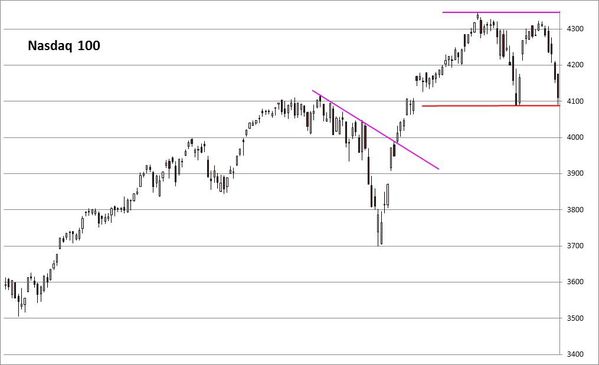
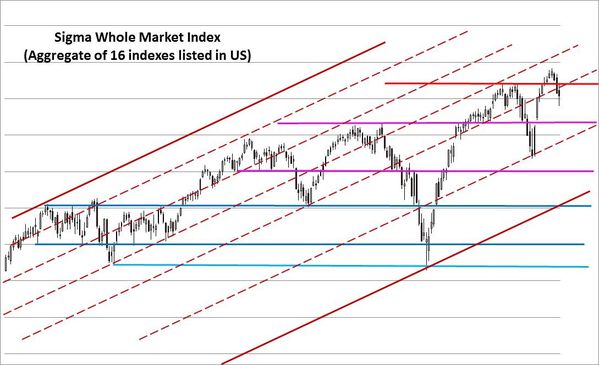
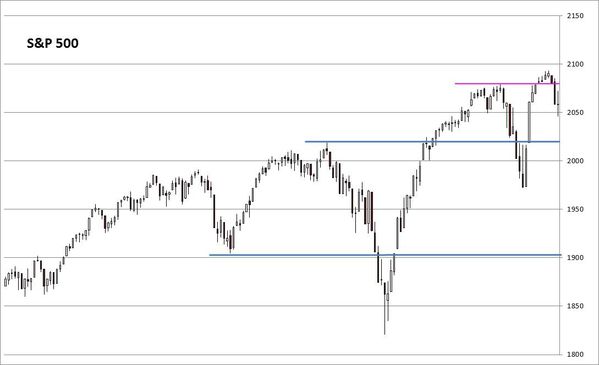
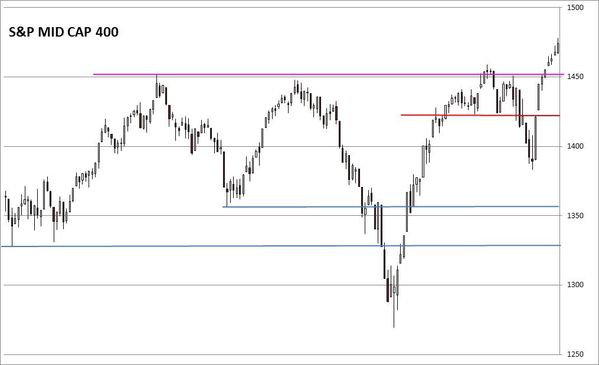
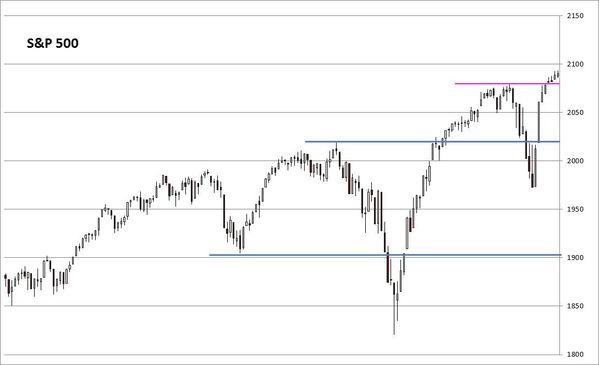
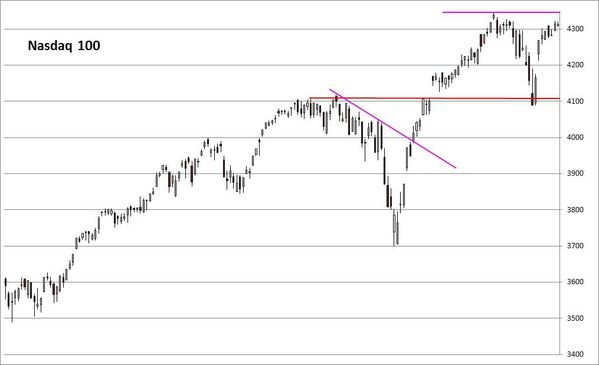
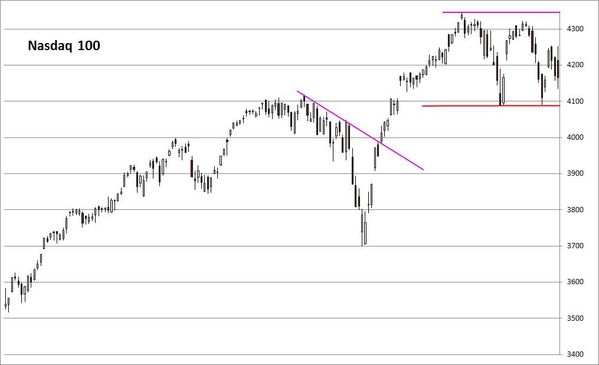
  After a good start, the US market faced a strong reversal. This kind of candle is bearish but the market found some supports around the red dotted ascending line. So, all in all, not as bad as it could look at first glance.

US-Daily-Chart_SWM_20150114.jpg


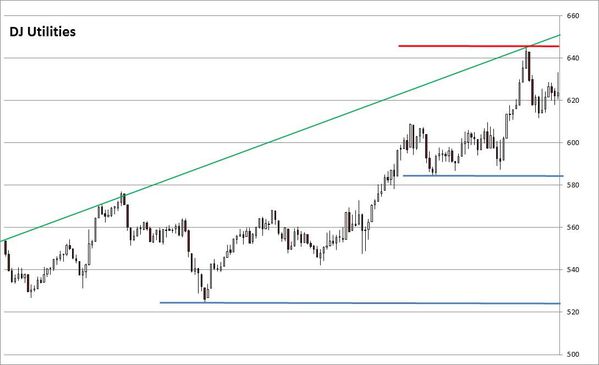
Most US indexes remain above strong support but Tuesday's candle looks like a "key reversal day" (mainly on the DJ Utilities). In order to be validated, this reversal day needs to be confirmed in coming session (by another leg down). So, there is no drama at this stage.


US-Daily-ChartSP500_20150114.jpg


US-Daily-ChartDJU_20150114.jpg


US-Daily-ChartNDX_20150114.jpg


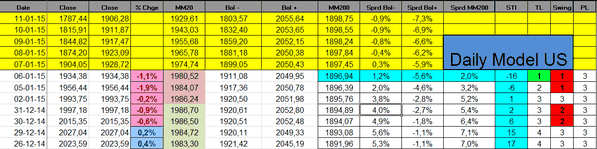
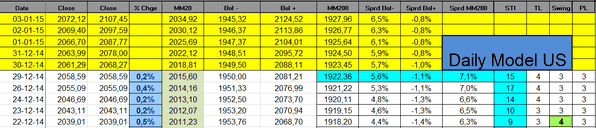
  The Sigma Trend Index remains in negative territory.
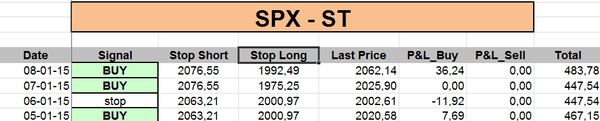
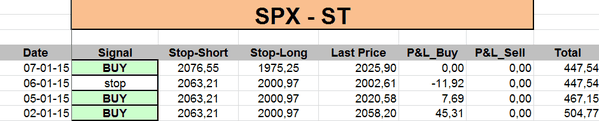
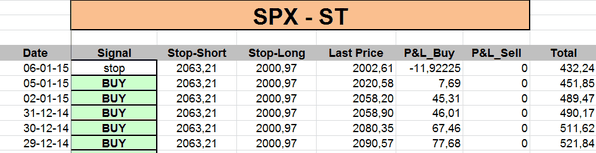
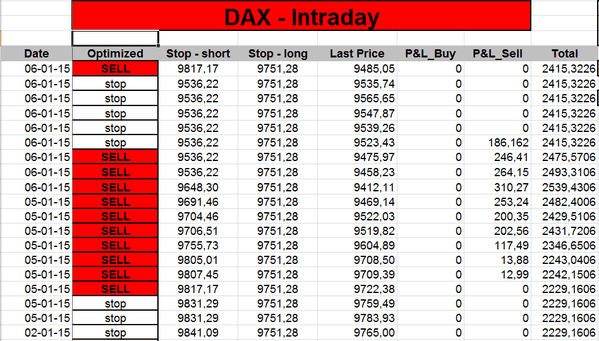
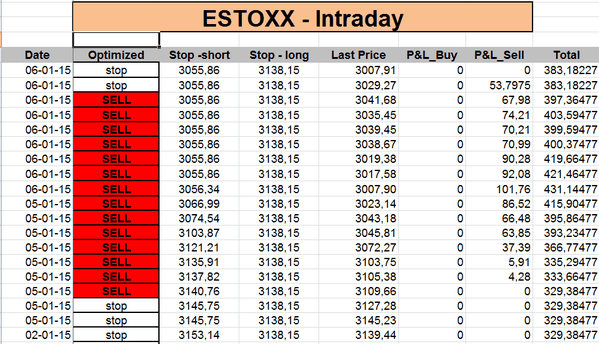
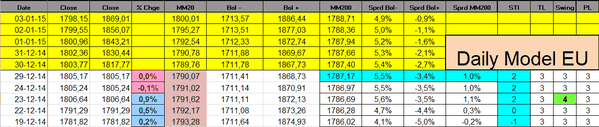
 

stmodel20150113.PNG


Daily Trading Book: 

- SPX: long at 2026.41 (stop @ 1989, 3pts below the ST model to take into account bid/ask spread)
- NDX: long at 4236.28 (2014's close) (stop @ 4035, 5pts below the ST model to take into account bid/ask spread)
- CAC: stopped
- EuroStoxx50: stopped
- DAX:  stopped
- IBEX: stopped


Partager cet article
Repost0
13 janvier 2015 2 13 /01 /janvier /2015 09:17
Europe:

The Sigma Whole Europe Index remains in difficult territory: it seems unable to print fresh medium term highs (unable to move above the pink horizontal resistances).


EU-Daily-Chart_SWEU_20150113.jpg


Looking at European trend, we can notice that even if the long term uptrend remains in place, medium term trend is in a distribution pattern while short term trend is rather in a downtrend (or consolidation).


MOMO_LT-SWME_LT_Trend_20150113.jpg

MOMO_MT-SWME_MT_Trend_20150113.jpg

MOMO_ST-SWME_ST_Trend_20150113.jpg


The Sigma Trend Index is back in positive territory and the swing came in at '4'. It is important to notice the amount of impulsive move (up and down) in 10 latest trading sessions. This is not a good sign because this underlines that investors are highly nervous and they have no clear idea for the next direction: bulls and bears ae struggling.


steumodel20150112.PNG


This nervosity can also be seen when looking at the huge negative divergence between the Sigma Smart Index Europe (SSMIE) and the Sigma Whole Europe Index. This means that investors continue to reduce their equity exposure using derivatives (options).


EU-Daily-Chart_SSMI_20150113.jpg


United States:

The Sigma Whole Market Index is testing an important support. Let's see what happens in coming sessions.


US-Daily-Chart_SWM_20150113.jpg


Looking at the Sigma US market, we can notice that all trends remain positive at this stage.


MOMO_LT-SWM_LT_Trend_20150113.jpg

MOMO_MT-SWM_MT_Trend_20150113.jpg

MOMO_ST-SWM_ST_Trend_20150113.jpg


The Sigma Trend Index is close to its zero line and the Swing came in at '2' for the second day in a row. Let's see what happens next.


STmodel20150112.PNG


Daily Trading Book: 

- SPX: long at 2026.41 (stop @ 1989, 3pts below the ST model to take into account bid/ask spread)
- NDX: long at 4236.28 (2014's close) (stop @ 4035, 5pts below the ST model to take into account bid/ask spread)
- CAC: stopped
- EuroStoxx50: stopped
- DAX:  stopped
- IBEX: stopped
Partager cet article
Repost0
12 janvier 2015 1 12 /01 /janvier /2015 09:10
Europe:

The Sigma Whole Europe Index had a volatile day on Friday: the index lost nearly all the gain it booked on Thursday. This is the best sign that investors are getting nervous on this market.


EU-Daily-Chart_SWEU_20150112-copie-1.jpg


We can also notice this situation looking at the chart of the volatility of the European volatility: we are close to 18 months high. On a short term basis this is not necessarily a bad news because a short term peak on this shart is usually followed by a short term rally on the equity market. Nevertheless if the vol of the vol remains at elevated levels for several weeks/months, we could get a sharp decline in the market because investors don't like high volatility.


EU-Daily-Chart_Vol_V2X_20150112.jpg


The Sigma Trend Index moved back in negative territory and the Swing came in at '1', telling us the decline was highly imulsive.


steumodel20150109.PNG


United States:

The Sigma Whole Market Index also declined on Friday. As long as the market remains above the red dotted ascending line, we can consider the market is not in danger but we need a clear move above the red horizontal resistance in order to restore the bull run.


US-Daily-Chart-Candle_20150112.jpg


Looking at key US indexes, the situation is very similar to the one from the Sigma Whole Market Index: we can't draw any conclusion at this stage.


US-Daily-ChartNDX_20150112.jpg

US-Daily-ChartRUT_20150112.jpg

US-Daily-ChartMID_20150112.jpg

US-Daily-ChartSP500_20150112.jpg


The Sigma Trend Index is close to its zero line, let's see what happens early next week.


stmodel20150109.PNG


Daily Trading Book: 

- SPX: long at 2026.41 (stop @ 1989, 3pts below the ST model to take into account bid/ask spread)
- NDX: long at 4236.28 (2014's close) (stop @ 4035, 5pts below the ST model to take into account bid/ask spread)
- CAC: stopped
- EuroStoxx50: stopped
- DAX:  stopped
- IBEX: stopped
Partager cet article
Repost0
9 janvier 2015 5 09 /01 /janvier /2015 08:58
Europe:

The Sigma Whole Europe Index enjoyed an impressive rally, daily volatility is picking up. According to CNBC (but I didn't had the opportunity to double check numbers) the volatility of European volatility hit multi months high. This means both bulls and bears are getting very nervous.


EU-Daily-Chart_SWEU_20150109.jpg


Looking at key European indexes, we can notice a huge white candle on Thursday. Nevertheless, most of them are still below major resistances. So, it is too early to say the correction is over.


EU-Daily-ChartSTOXX600_20150109.jpg

EU-Daily-ChartDAX_20150109.jpg

EU-Daily-ChartEUSMALL200_20150109.jpg

EU-Daily-ChartESTOXX_20150109.jpg

EU-Daily-ChartCAC_20150109.jpg


The Sigma Trend Index jumped to'6' and the Swing came in at '5', telling us the day was highly impulsive.


steumodel20150108.PNG


United States:

The Sigma Whole Market Index enjoyed a nice bounce back and was able to move above the pink horizontal resistance. In order to restore the bull run, the market needs to move above the red horizontal resistance.


US-Daily-Chart-Candle_20150109.jpg


We believe the Nasdaq 100 remains the key US index to focus on at this stage: the break of current trading range (delimited by the pink and the red horizontal lines) should indicate the direction of the next move.


US-Daily-ChartNDX_20150109.jpg

US-Daily-ChartSP500_20150109.jpg

US-Daily-ChartRUT_20150109.jpg


The Sigma Trend Index moved in positive territory and the Swing came in at '5', telling us the move was highly impulsive.


stmodel20150108.PNG


The ST model upifted its stop on the SPX:


stspx20150108.PNG


Daily Trading Book: 

- SPX: long at 2026.41 (stop @ 1989, 3pts below the ST model to take into account bid/ask spread)
- NDX: long at 4236.28 (2014's close) (stop @ 4035, 5pts below the ST model to take into account bid/ask spread)
- CAC: stopped
- EuroStoxx50: stopped
- DAX:  stopped
- IBEX: stopped
Partager cet article
Repost0
8 janvier 2015 4 08 /01 /janvier /2015 09:03
Europe:

The Sigma Whole Europe Index had a small bounce back on Wednesday. Nevertheless it is impossible to say at this stage if it is just a bounce back in a downtrend or if it is the end of the "correction".


EU-Daily-Chart_SWEU_20150108.jpg


Looking at key EU indexes, we can notice that December's gaps were closed but there is no sign the correction is over: a retest of the next horizontal support seems more likely on a 10 days basis but a short term bounce back remains possible.


EU-Daily-ChartSTOXX600_20150108.jpg

EU-Daily-ChartESTOXX_20150108.jpg

EU-Daily-ChartDAX_20150108.jpg

EU-Daily-ChartCAC_20150108.jpg


The Sigma Trend Index remains in negative territory, all other indicators are neutral at '3'.


steumodel20150107.PNG


United States:

The Sigma Whole Market Index enjoyed a strong bounce back and it is right below the pink resistance. The red ascending line acted twice as a support, this line will be important to monitor.


US-Daily-Chart-Candle_20150108.jpg


Looking at key indexes, we can notice the 4100 level is very important for the NDX. On other indexes, we are between support and resistance, so it is very difficult to have a clear opinion here.

The best thing to do is (probably) to monitor the NDX: as long as it remains above '4100', it is ok but if it closes below this level, this is a very bad signal.


US-Daily-ChartNDX_20150108.jpg

US-Daily-ChartSP500_20150108.jpg

US-Daily-ChartRUT_20150108.jpg

US-Daily-ChartMID_20150108.jpg


The Sigma Trend Index is now at '-4', not far from its zero line. It will be interesting to see if it can move in positive territory.

The Swing came in at '5'. As the Trend Level (TL) was at '1' on Tuesday, this means the ST model generated a fresh buy signal on US markets.

It is not a question to know if we are convinced or not by this signal but we are focused on our model, and discipline is key in trading. Feeling and sentiment is your worst enemy.


stmodel20150107.PNG


stspx20150107.PNG


So, we bought 1 SPX at 2026.41


Daily Trading Book: 

- SPX: long at 2026.41 (stop @ 1972, 3pts below the ST model to take into account bid/ask spread)
- NDX: long at 4236.28 (2014's close) (stop @ 4035, 5pts below the ST model to take into account bid/ask spread)
- CAC: stopped
- EuroStoxx50: stopped
- DAX:  stopped
- IBEX: stopped
Partager cet article
Repost0
7 janvier 2015 3 07 /01 /janvier /2015 08:18
Europe:

The Sigma Whole Europe Index continues to slide and we continue to get lower highs and lower lows (for a couple of months now). This is an important sign of weakness and we don't underestimate this signal.


EU-Daily-Chart_SWEU_20150107.jpg


Looking at some key European indexes, we can notice this weakness is well spread across the continent (even for the DAX).


EU-Daily-ChartDAX_20150107.jpg

EU-Daily-ChartSTOXX600_20150107.jpg

EU-Daily-ChartESTOXX_20150107.jpg

EU-Daily-ChartCAC_20150107.jpg


Looking at the Sigma Smart Money Index Europe, we can notice a sharp negative divergence with the Sigma Whole Europe Index. This means that big investors continue to reduce their exposure to the European market.


EU-Daily-SSMI_20150107.jpg


The Sigma Trend Index continues to slide (at '-9') but we are not in oversold territory (yet). This means that it is too early to buy. The Swing came in at '2', telling us the decline was slightly impulsive.


steumodel20150106.PNG


United States:

The Sigma Whole Market declined below a major support. The situation becomes highly dangerous for the bull case.


US-Daily-Chart-Candle_20150107.jpg


Most major indexes are now in critical territory and the Russell2000 and the MidCap400 are now in a double pattern (with a false break/bull trap).


US-Daily-ChartRUT_20150107.jpg

US-Daily-ChartMID_20150107.jpg


The double pattern is also clear on the NDX. This index is right on a major horizontal support, it is very important to keep this level or we will get another downleg.


US-Daily-ChartNDX_20150107.jpg


The Sigma Trend Index declined to '-16' and the Trend Level (TL) is at '1'. So, the ST model is ready to generate a buy signal.


stmodel20150106.PNG


The SPX declined below our stop level, so we cut our long position:


stspx20150106.PNG


- SPX: 1997.87 - 2058.9 = - 61.03 (loss)


Daily Trading Book: 

- SPX: stopped
- NDX: long at 4236.28 (2014's close) (stop @ 4035, 5pts below the ST model to take into account bid/ask spread)
- CAC: stopped
- EuroStoxx50: stopped
- DAX:  stopped
- IBEX: stopped


Presentation of our intraday model:

While the ST model is based on a trend reversal approach, the intraday model (UST Model) is a trend based model. So, both models are working on different approach.


We have been working on intraday models for a couple of quarters and we are testing them in the market since early September. We are happy with current results and we hope to launch the new internet site (with a lot of new functionalities) by the end of H1: strategy approach - equity model portfolios - quant models for index trading (intraday and daily based).


For the time being, most intraday models are short and some are neutral.(those models are hourly based)


intraspx20150106.PNG

US-Hourly-Perfo_SPX_20150107-053901.jpg

intrandx20150106.PNG

US-Hourly-Perfo_NDX_20150107-053901.jpg

intraDAX20150106.PNG

EU-Hourly-Perfo_DAX_20150107-060222.jpg

intraSMI20150106.PNG

EU-Hourly-Perfo_SMI_20150107-060222.jpg

intraEstox20150106.PNG

EU-Hourly-Perfo_ESTOX_20150107-060222.jpg

intraCAC20150106.PNG

EU-Hourly-Perfo_CAC_20150107-060222.jpg

Partager cet article
Repost0
6 janvier 2015 2 06 /01 /janvier /2015 10:39
Europe:

The Sigma Whole Europe Index was under heavy selling pressure on Monday. It is important to keep the blue horizontal support or the market will be at risk to retest October's low.


EU-Daily-Chart_SWEU_20150106.jpg


Looking at other major European markets, the situation looks very bad:


EU-Daily-ChartESTOXX_20150106.jpg

EU-Daily-ChartSTOXX600_20150106.jpg

EU-Daily-ChartCAC_20150106.jpg

EU-Daily-ChartDAX_20150106.jpg


The Sigma Trend Index declined to '-8' and the Swing came in at '1' telling us the decline was highly impulsive.


Steumodel20150105.PNG


United States:

The Sigma Whole Market Index had a bad session on Monday. We are right on a major support; it is very important to keep this level or the selling pressure will probably intensify.


US-Daily-Chart-Candle_20150106.jpg


Many US indexes are now at risk :


US-Daily-ChartSP500_20150106.jpg

US-Daily-ChartNDX_20150106.jpg

US-Daily-ChartRUT_20150106.jpg


The Sigma Trend Index declined to '-6' and the Swing indicator came in at '1', telling us the decline was highly impulsive.


stmodel20150105.PNG


Short Term Trading Book: 

- SPX: long at 2058.9 (2014's close) (stop @ 1998, 3pts below the ST model to take into account bid/ask spread
- NDX: long at 4236.28 (2014's close) (stop @ 4035, 5pts below the ST model to take into account bid/ask spread)
- CAC: stopped
- EuroStoxx50: stopped
- DAX:  stopped
- IBEX: stopped
Partager cet article
Repost0
5 janvier 2015 1 05 /01 /janvier /2015 08:42
Europe:

The Sigma Whole Europe Index is testing an important horizontal support. This market will remain under pressure as long as it prints lower highs and lower lows.


EU-Daily-Chart_SWEU_20150105.jpg


Looking at some key European markets, the danger is evident.


EU-Daily-ChartSTOXX600_20150105.jpg

EU-Daily-ChartEUSMALL200_20150105.jpg

EU-Daily-ChartCAC_20150105.jpg

EU-Daily-ChartESTOXX_20150105.jpg

EU-Daily-ChartDAX_20150105.jpg


The Sigma Trend Index remains near its zero line: a decline in negative territory would be another bad signal for European markets.


steumodel20150102.PNG


United States:

The Sigma Whole Market (SWM) Index was under pressure on Friday but it is too early to say if we printed a medium term top or if we have a short term consolidation. As long as the SWM stays above October's low, the short term consolidation is our favorite scenario.


US-Daily-Chart-Candle_20150105.jpg


Looking at some US indexes, there is no sign of reversal but the weakness in the NDX remains something to focus on because current pattern looks like a double top.


US-Daily-ChartNDX_20150105.jpg

US-Daily-ChartSP500_20150105.jpg

US-Daily-ChartRUT_20150105.jpg


The Sigma Trend Index is also close to its zero line. So, this indicator tells us there is more danger than it looks at first glance.


stmodel20150102.PNG

Short Term Trading Book: 

- SPX: long at 2058.9 (2014's close) (stop @ 1998, 3pts below the ST model to take into account bid/ask spread
- NDX: long at 4236.28 (2014's close) (stop @ 4035, 5pts below the ST model to take into account bid/ask spread)
- CAC: stopped
- EuroStoxx50: stopped
- DAX:  stopped
- IBEX: stopped
Partager cet article
Repost0
31 décembre 2014 3 31 /12 /décembre /2014 09:03
Europe:

The Sigma Whole Europe Index started a pullback on Tuesday. It will be very important to move above the 3 horizontal resistances in early January or we will reinforce the bearish scenario on this market.

For sure, the ECB effect (on the 22nd of January) should boost the market but the Greek effect could weight on markets. So, all in all, it is difficult to have an opinion on the net imact.


EU-Daily-Chart_SWEU_20141231.jpg


It is clear that some key European indexes are struggling with major resistances and seem unable to move above those levels.


EU-Daily-ChartSTOXX600_20141231.jpg

EU-Daily-ChartEUSMALL200_20141231.jpg

EU-Daily-ChartDAX_20141231.jpg

EU-Daily-ChartESTOXX_20141231.jpg

EU-Daily-ChartCAC_20141231.jpg


The Sigma Trend Index remains is testing its zero line and the Swing came in at '2' telling us the decline was slightly impulsive. It is very important that the STI remains above '0' in coming sessions. Europe is once again in a critical situation.


steumodel20141230.PNG


United States:

The Sigma Whole Market Index is in consolidation mode. It will be important to keep the red horizontal support.


US-Daily-Chart-Candle_20141231.jpg


Looking at some major indexes, we can notice the NDX lost most of its momentum and is now in a weak situation (relative to the SWM). This is not a major problem at this stage, but this is something to monitor.


US-Daily-ChartNDX_20141231.jpg

US-Daily-ChartSP500_20141231.jpg

US-Daily-ChartMID_20141231.jpg


It will be important to monitor if the Russell achieved a real breakout or if it was a bull trap.


US-Daily-ChartRUT_20141231.jpg


The Sigma Trend Index declined from '15' to '6'. The Swing came in at '2', telling us the decline was slightly impulsive. There is no danger at this time, this could be a consolidation phase prior to another rally.


stmodel20141230.PNG


There is no change in our positions:

Short Term Trading Book: 

- SPX: long at 2011.14(stop @ 1998, 3pts below the ST model to take into account bid/ask spread
- NDX: long at 3828.03(stop @ 4035, 5pts below the ST model to take into account bid/ask spread)
- CAC: stopped
- EuroStoxx50: stopped
- DAX:  stopped
- IBEX: stopped
Partager cet article
Repost0
30 décembre 2014 2 30 /12 /décembre /2014 07:37
Europe:

The Sigma Whole Europe Index had a volatile session but was finally able to stay above a key horizontal support (blue line). For sure the Greece will remain an important topic in early 2015 and the election campaign could create some volatility on the European market.


EU-Daily-Chart_SWEU_20141230.jpg


Looking at some European indexes, most of them remain at critical point, it is too early to say we are out of the wood. Nevertheless, Monday's 'hammer' is a positive sign.


EU-Daily-ChartDAX_20141230.jpg

EU-Daily-ChartSTOXX600_20141230.jpg

EU-Daily-ChartCAC_20141230.jpg

EU-Daily-ChartESTOXX_20141230.jpg


The Sigma Trend Index remains at '2'. All other indicators are neutral at '3'


steumodel20141229.PNG


United States:

The Sigma Whole Market Index remains above its major horizontal support. It seems like nothing can stop this market.


US-Daily-Chart-Candle_20141230.jpg


Looking at some US indexes, the situation is very healthy, there is no cloud at this time. The Nasdaq 100 is the only point of attention because a double top pattern could be under 'construction'.


US-Daily-ChartSC600_20141230.jpg

US-Daily-ChartMID_20141230.jpg

US-Daily-ChartRUT_20141230.jpg

US-Daily-ChartSP500_20141230.jpg

US-Daily-ChartNDX_20141230.jpg


The Sigma Trend Index declined to '15'. Both the Swing and the Power Level (PL) were neutral at '3'.


stmodel20141229.PNG


There is no change in our positions:

Short Term Trading Book: 

- SPX: long at 2011.14(stop @ 1998, 3pts below the ST model to take into account bid/ask spread
- NDX: long at 3828.03(stop @ 4035, 5pts below the ST model to take into account bid/ask spread)
- CAC: stopped
- EuroStoxx50: stopped
- DAX:  stopped
- IBEX: stopped
Partager cet article
Repost0

Presentation

  • : Le blog de sigmatradingoscillator
  • : Professionnel de la finance de marché depuis plus de 10ans, j'ai mis au point une série d'outils de trading me permettant de prendre et couper mes positions. Ici, j'écris un update quotidien sur la situation du CAC,DAX, Eurostoxx, SP500, Nasdaq100. Attention Les éléments repris dans ce blog représentent uniquement mon opinion personnelle et ne constituent en aucun cas une incitation au trading ou du conseil financier. Pour du conseil, consultez votre conseiller en placement
  • Contact

Disclaimer

NO MATERIAL HERE CONSTITUTES "INVESTMENT ADVICE" NOR IS IT A RECOMMENDATION TO BUY OR SELL ANY FINANCIAL INSTRUMENT, INCLUDING BUT NOT LIMITED TO STOCKS, COMMODITIES, OPTIONS, BONDS, FUTURES, OR BULLION. ACTIONS YOU UNDERTAKE AS A CONSEQUENCE OF OUR ANALYSIS, OPINION OR ADVERTISEMENT ON THIS SITE ARE YOUR SOLE RESPONSIBILITY.

FOR INVESTMENT ADVICE, PLAN A MEETING WITH A FINANCIAL ADVISOR IN ORDER TO ESTABLISH YOUR OWN RISK PROFILE.

Archives

Pages