10 juillet 2013
3
10
/07
/juillet
/2013
08:50
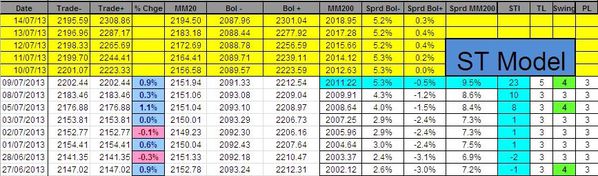
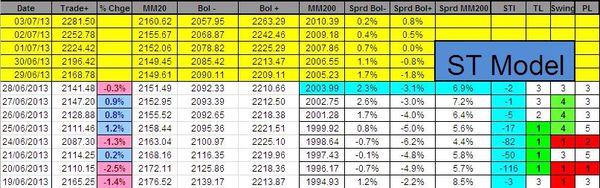
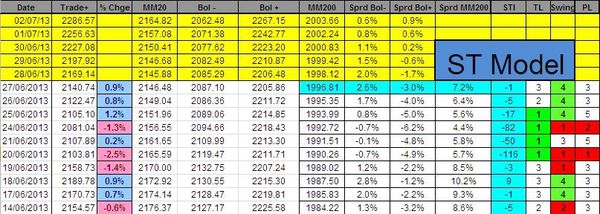
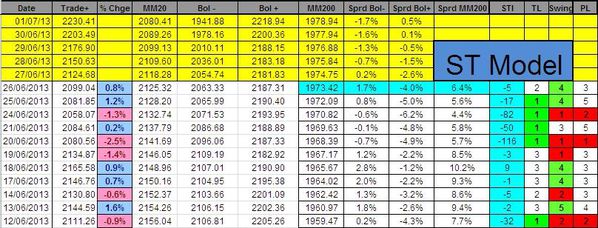
The Sigma Trend Index is now at '23', not far from the key '34' level (level we need to achieve in order to generate a short trade).
On the 16 indexes we track, 5 are already in overbought territory and 8 are very close to this level.
This means that another upmove on Wednesday would probably push the Sigma Trend Index (STI) above the key '34' level.
The ST model uplifted stop levels on all indexes:

Trading Book:
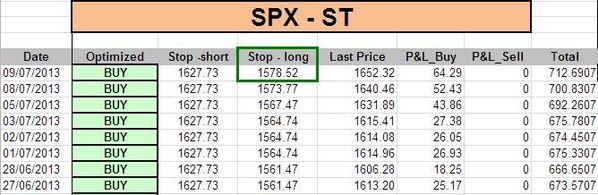
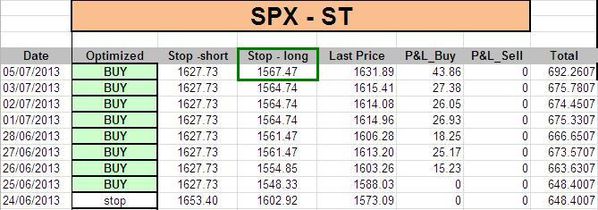
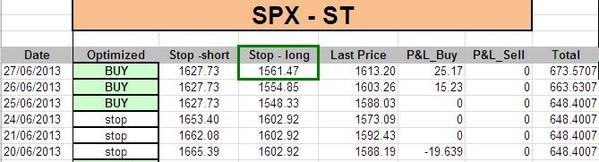
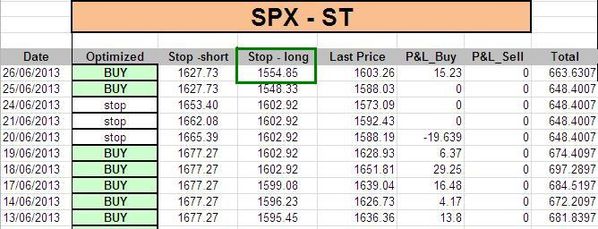
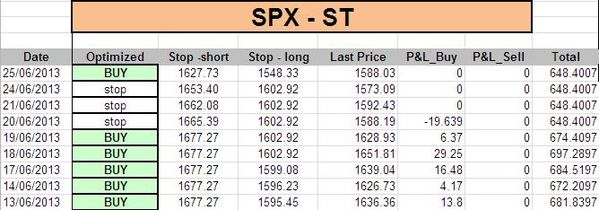
- SPX: 1 long at 1588.17 (stop @ 1575, 3pts below the model to take into account bid/ask spread)
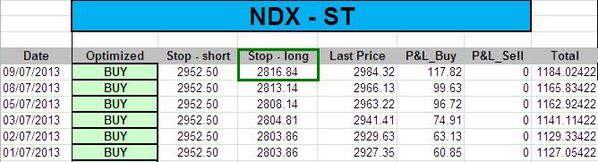
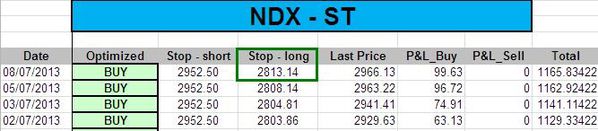
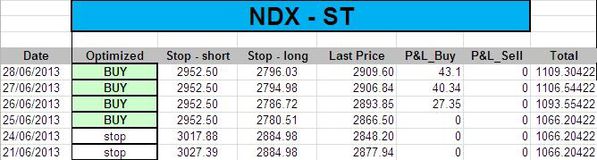
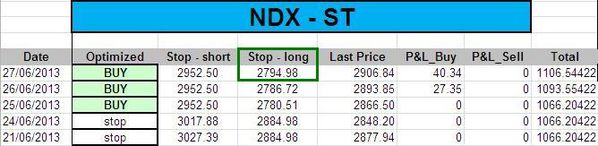
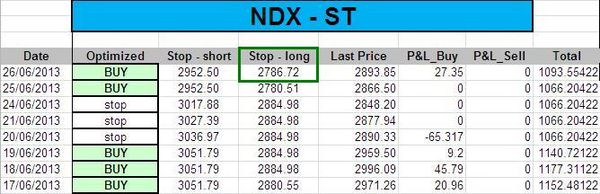
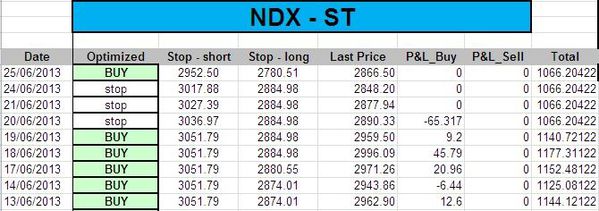
- NDX: 1 long at 2868.65 (stop @ 2812, 5pts below the model to take into account bid/ask spread)
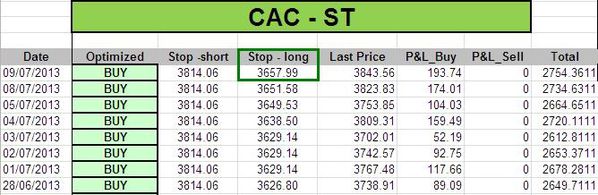
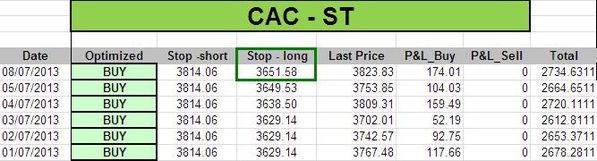
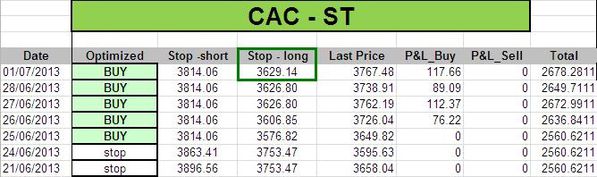
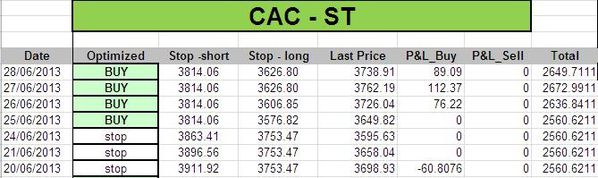
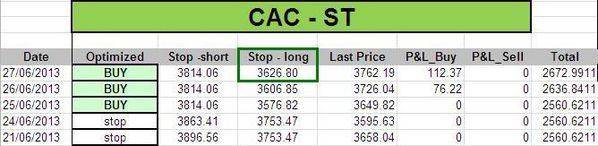
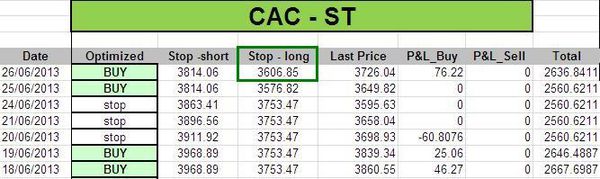
- CAC: 1 long at 3657.24 (stop @ 3653, 5pts below the model to take into account bid/ask spread)
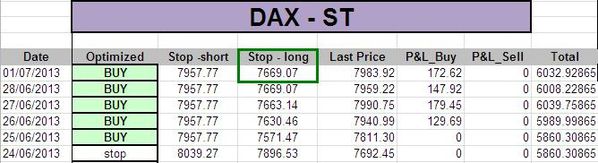
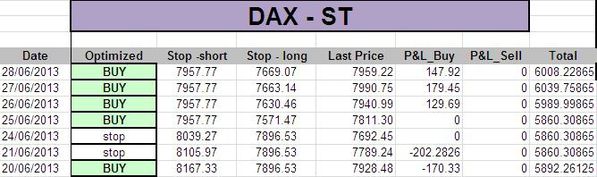
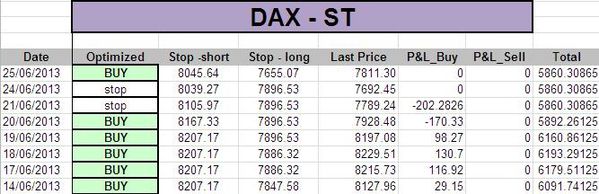
- DAX: 1 long at 7817.14 (stop @ 7684, 10pts below the model to take into account bid/ask spread)
Published by sigmatradingoscillator
-
dans
Market Analysis
9 juillet 2013
2
09
/07
/juillet
/2013
08:12
Both US and European equity markets moved higher on Monday. The DAX enjoyed a strong up move, but it remains the weakest on a chart basis.
The Sigma trend Index (STI) is at '10' (firmly in positive) while all other indicators are neutral at '3'.

Our ST model uplifted its stop levels for all indexes except for the DAX:

Trading Book:
- SPX: 1 long at 1588.17 (stop @ 1570, 3pts below the model to take into account bid/ask spread)
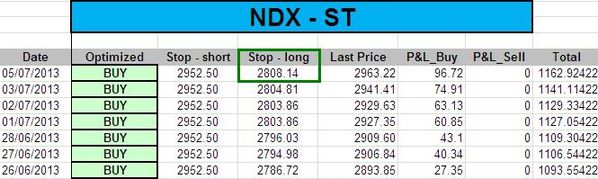
- NDX: 1 long at 2868.65 (stop @ 2808, 5pts below the model to take into account bid/ask spread)
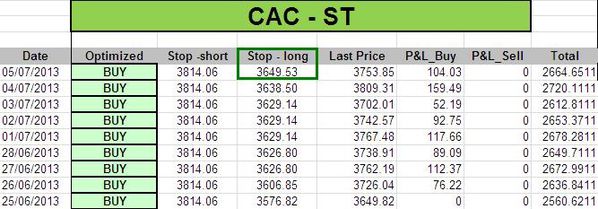
- CAC: 1 long at 3657.24 (stop @ 3646, 5pts below the model to take into account bid/ask spread)
- DAX: 1 long at 7817.14 (stop @ 7659, 10pts below the model to take into account bid/ask spread)
Published by sigmatradingoscillator
-
dans
Market Analysis
7 juillet 2013
7
07
/07
/juillet
/2013
10:21
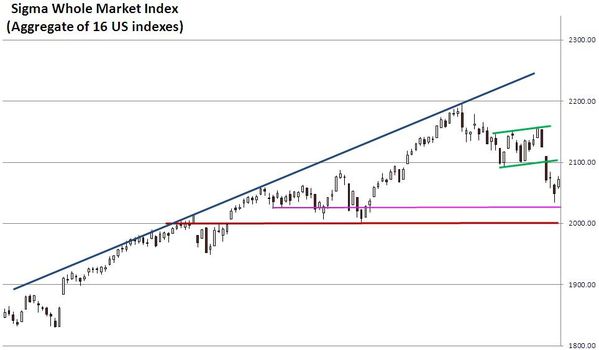
This weekend, we want to add a chart analysis to the results of our short term quant model because we have a clear divergence between US and EU (once again)..
Looking at the US, we can see the market is well oriented. Current rebound is powerful and the next serious resistance is around 2200. This level seems achievable in coming days.

Looking at the CAC40, we can notice current rebound is less impressive than in the US, and it seems a possible HS is under construction (neckline @ 3600). This pattern has to be monitored in coming days.
The CAC closed a gap on Friday before reversing all the early gains. This doesn't sound bullish for coming sessions.

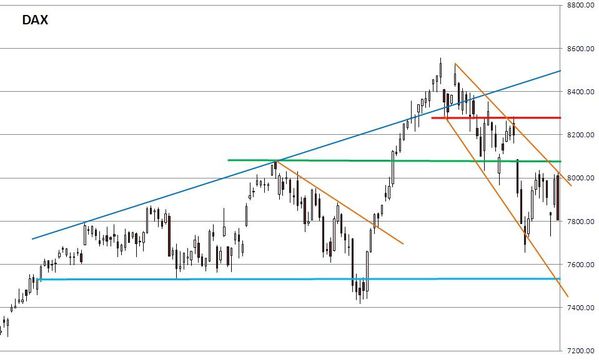
Looking at the DAX, we can notice current rebound is very weak (even weaker than for the CAC40). Recent gap remains open, and Friday's top was lower than last week's top. Moreover, the DAX remains stuck in a broadening downtrend channel.
Our ST quant model uplifted some stop levels:

Trading Book:
- SPX: 1 long at 1588.17 (stop @ 1564, 3pts below the model to take into account bid/ask spread)
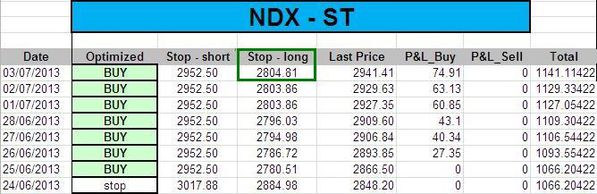
- NDX: 1 long at 2868.65 (stop @ 2803, 5pts below the model to take into account bid/ask spread)
- CAC: 1 long at 3657.24 (stop @ 3644, 5pts below the model to take into account bid/ask spread)
- DAX: 1 long at 7817.14 (stop @ 7659, 10pts below the model to take into account bid/ask spread)
Published by sigmatradingoscillator
-
dans
Market Analysis
4 juillet 2013
4
04
/07
/juillet
/2013
08:32
After a negative open, the market was able to recover all its losses and to close well in positive territory.
The Sigma Trend Index (STI) remains in positive territory (but very close to its zero line) and other indicators remain neutral at '3'.

The NDX's stop level has been uplifted by the model. Other indexes are unchanged:
Trading Book:
- SPX: 1 long at 1588.17 (stop @ 1562, 3pts below the model to take into account bid/ask spread)
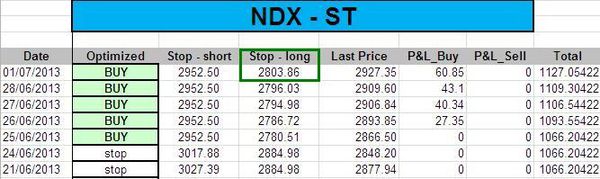
- NDX: 1 long at 2868.65 (stop @ 2800, 5pts below the model to take into account bid/ask spread)
- CAC: 1 long at 3657.24 (stop @ 3624, 5pts below the model to take into account bid/ask spread)
- DAX: 1 long at 7817.14 (stop @ 7659, 10pts below the model to take into account bid/ask spread)
Published by sigmatradingoscillator
-
dans
Market Analysis
3 juillet 2013
3
03
/07
/juillet
/2013
07:36
Following Tuesday's session, there is no change in the ST model.
The Sigma Trend Index(STI) remains above '0', all other indicators are neutral at '3'.

Trading Book:
- SPX: 1 long at 1588.17 (stop @ 1562, 3pts below the model to take into account bid/ask spread)
- NDX: 1 long at 2868.65 (stop @ 2798, 5pts below the model to take into account bid/ask spread)
- CAC: 1 long at 3657.24 (stop @ 3624, 5pts below the model to take into account bid/ask spread)
- DAX: 1 long at 7817.14 (stop @ 7659, 10pts below the model to take into account bid/ask spread)
Published by sigmatradingoscillator
-
dans
Market Analysis
2 juillet 2013
2
02
/07
/juillet
/2013
08:14
The Sigma Trend Index (STI) is back in positive territory, other indicators are neutral at '3'.

The ST model uplifted stop levels as fallow:

Trading Book:
- SPX: 1 long at 1588.17 (stop @ 1562, 3pts below the model to take into account bid/ask spread)
- NDX: 1 long at 2868.65 (stop @ 2798, 5pts below the model to take into account bid/ask spread)
- CAC: 1 long at 3657.24 (stop @ 3624, 5pts below the model to take into account bid/ask spread)
- DAX: 1 long at 7817.14 (stop @ 7659, 10pts below the model to take into account bid/ask spread)
Published by sigmatradingoscillator
-
dans
Market Analysis
1 juillet 2013
1
01
/07
/juillet
/2013
07:40
There is not change in our indicators follwong Friday's session. The Sigma Trend Index remains close to its zero line but it is unable to move in positive territory.
The ST model adjusted some stop levels:

Trading Book:
- SPX: 1 long at 1588.17 (stop @ 1558, 3pts below the model to take into account bid/ask spread)
- NDX: 1 long at 2868.65 (stop @ 2791, 5pts below the model to take into account bid/ask spread)
- CAC: 1 long at 3657.24 (stop @ 3622, 5pts below the model to take into account bid/ask spread)
- DAX: 1 long at 7817.14 (stop @ 7659, 10pts below the model to take into account bid/ask spread)
Published by sigmatradingoscillator
-
dans
Market Analysis
28 juin 2013
5
28
/06
/juin
/2013
06:43
The market continues its bounce back. The Sigma Trend Index(STI) is testing its zero line.
Following Thursday's session, here are the updated stop levels (generated by our ST model):

Trading Book:
- SPX: 1 long at 1588.17 (stop @ 1558, 3pts below the model to take into account bid/ask spread)
- NDX: 1 long at 2868.65 (stop @ 2790, 5pts below the model to take into account bid/ask spread)
- CAC: 1 long at 3657.24 (stop @ 3622, 5pts below the model to take into account bid/ask spread)
- DAX: 1 long at 7817.14 (stop @ 7653, 10pts below the model to take into account bid/ask spread)
Published by sigmatradingoscillator
-
dans
Market Analysis
27 juin 2013
4
27
/06
/juin
/2013
07:50
The market continued its rebound on Wednesday. The STI is close to test its zero line.
Following Wednesday's rally, the ST model updated stop levels as fallow:

Trading Book:
- SPX: 1 long at 1588.17 (stop @ 1551, 3pts below the model to take into account bid/ask spread)
- NDX: 1 long at 2868.65 (stop @ 2781, 5pts below the model to take into account bid/ask spread)
- CAC: 1 long at 3657.24 (stop @ 3601, 5pts below the model to take into account bid/ask spread)
- DAX: 1 long at 7817.14 (stop @ 7620, 10pts below the model to take into account bid/ask spread)
Published by sigmatradingoscillator
-
dans
Market Analysis
26 juin 2013
3
26
/06
/juin
/2013
07:59
Looking at the chart, we are not sure that Tuesday's low was 'the low' or an intermediate low in a deeper correction.
But when we have a quant model to test, we must forget our own feeling, we must stick with signals generated by the model.
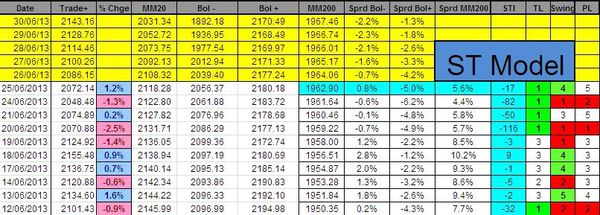
The Swing closed at '4'. As the Trend Level (TL) was at '1' on Monday, we got a fresh buy signal on Tuesday's close.
ST model:

Trading Book:
- SPX: 1 long at 1588.17 (stop @ 1545, 3pts below the model to take into account bid/ask spread)
- NDX: 1 long at 2868.65 (stop @ 2775, 5pts below the model to take into account bid/ask spread)
- CAC: 1 long at 3657.24 (stop @ 3571, 5pts below the model to take into account bid/ask spread)
- DAX: 1 long at 7817.14 (stop @ 7645, 10pts below the model to take into account bid/ask spread)
Published by sigmatradingoscillator
-
dans
Market Analysis


