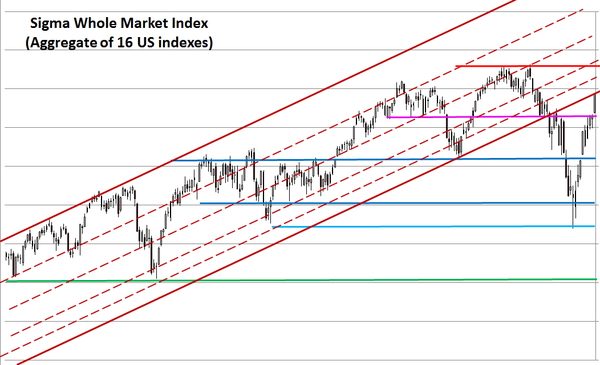
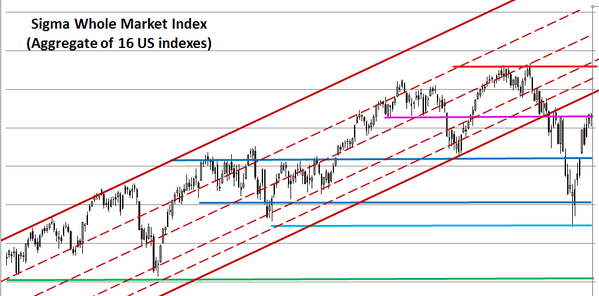
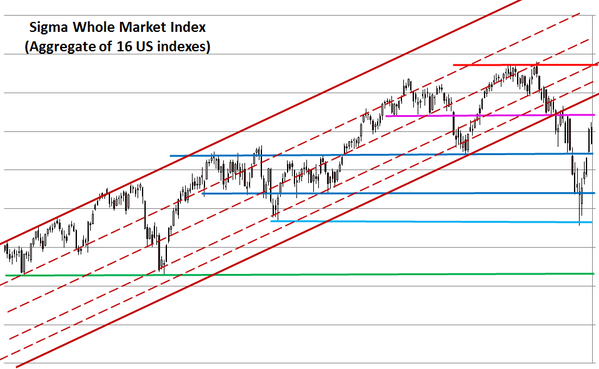
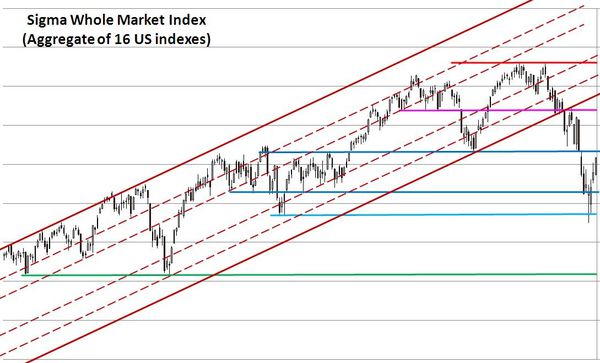
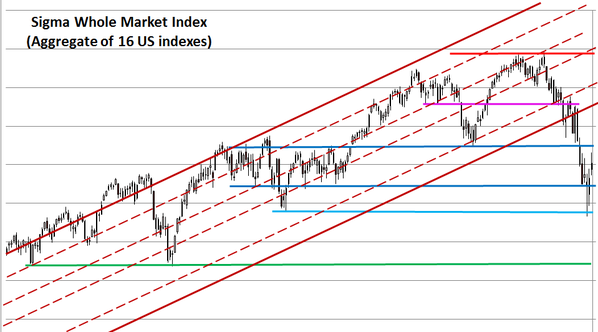
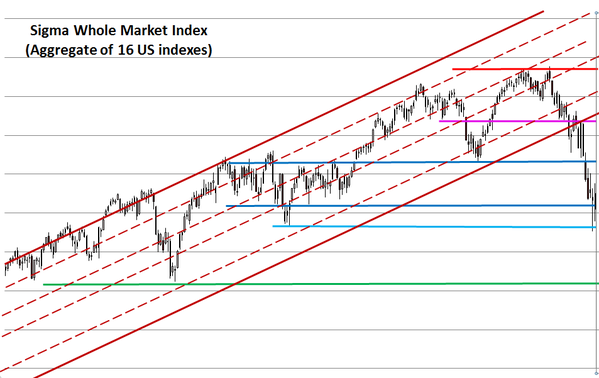
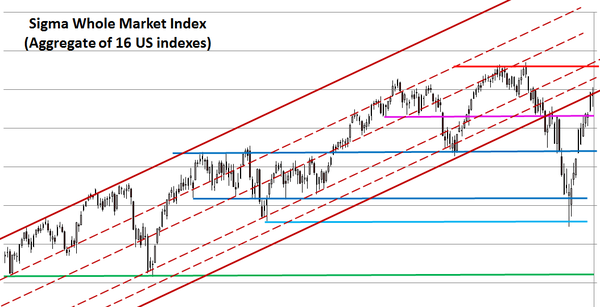
The Sigma Whole Market Index printed a 'doji' at the lower end of previous uptrend. It seems the market is losing some momentum but after such a rally this is rather normal. We can't interpret this as a bearish signal.
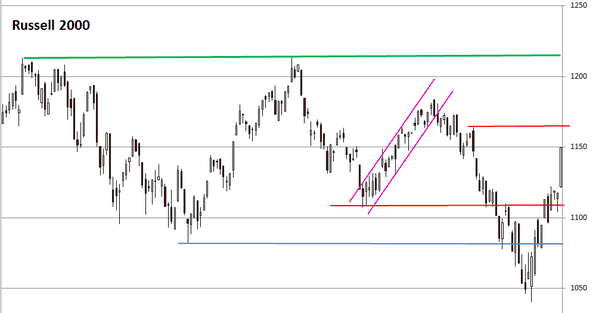
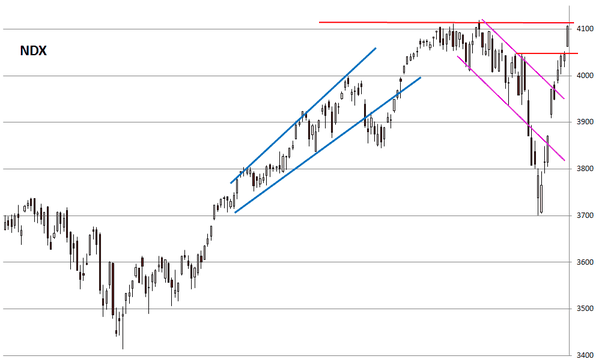
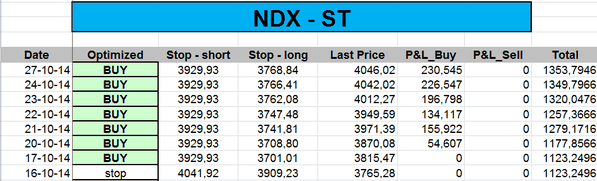
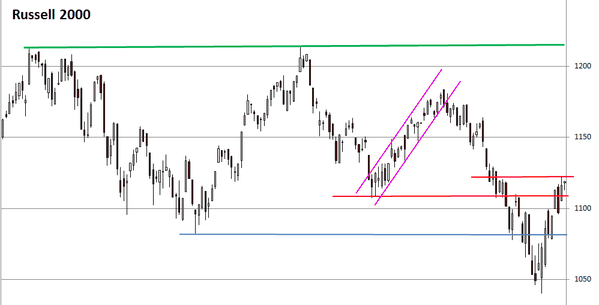
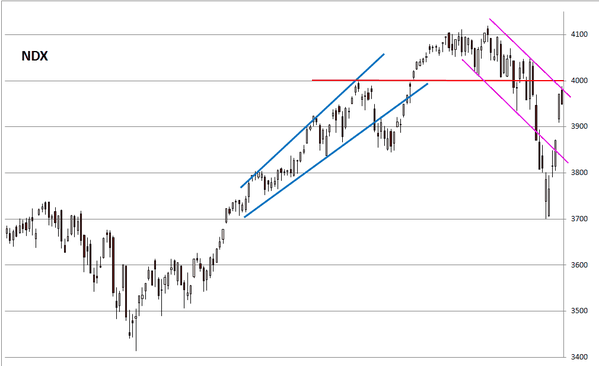
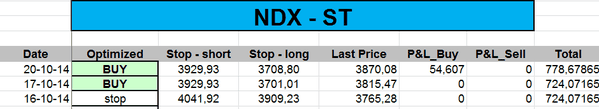
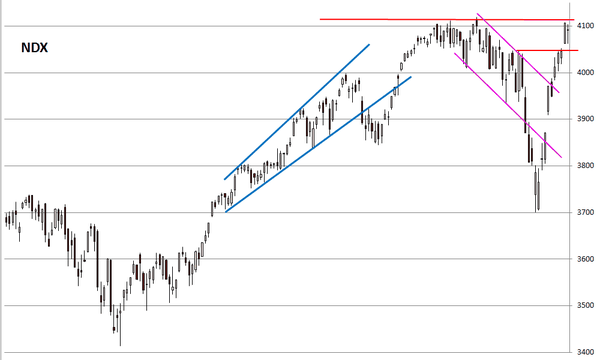
Looking at the NDX and the SmallCap600, those indexes are right below major resistance. We consider those 2 indexes are the key ones to focus on (at this stage): if they are able to print new historical highs then the whole market will continue its advance.
If they roll down from here, this could be the early sign that the rebound could be over.

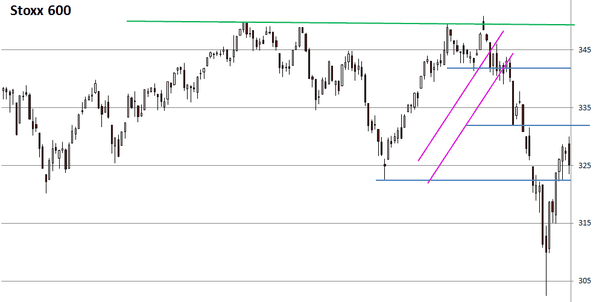
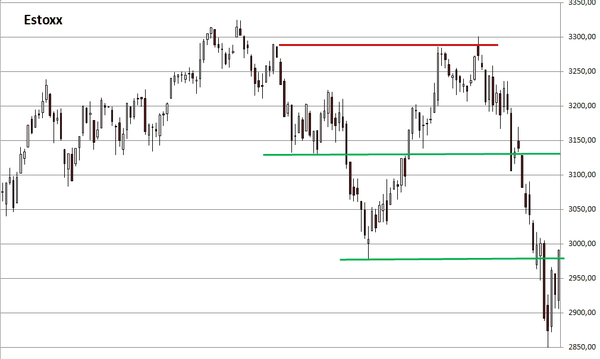
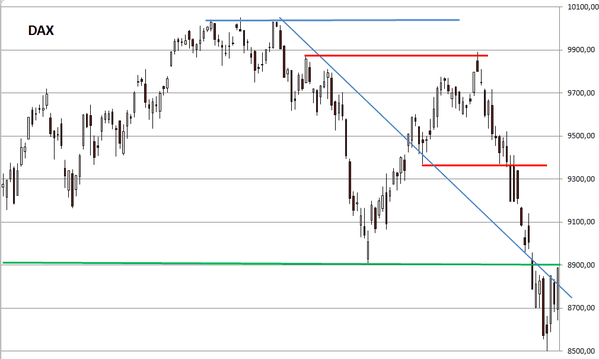
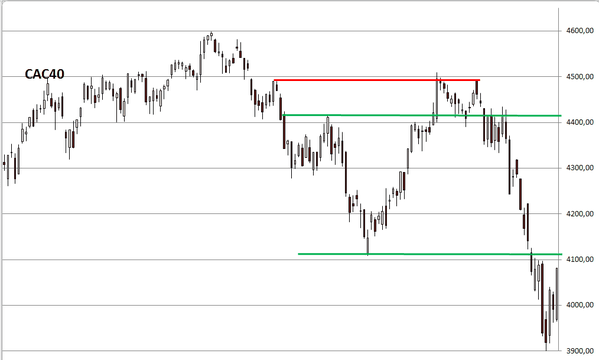
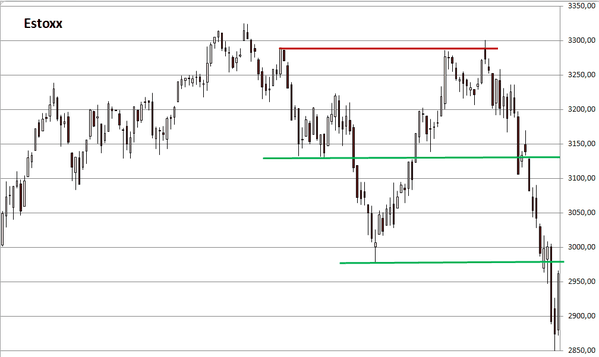
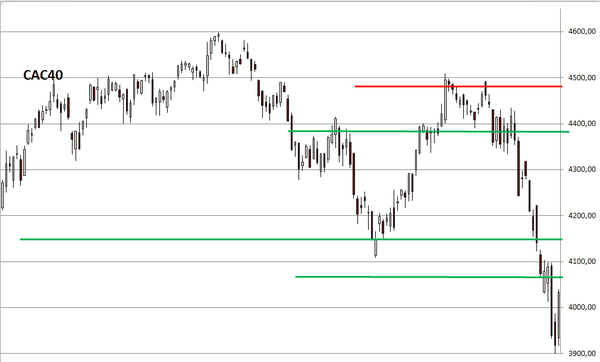
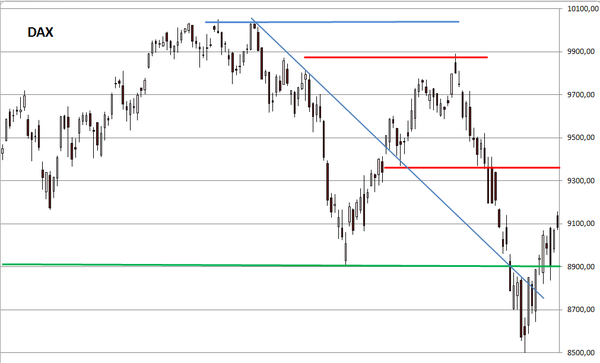
Looking at the Sigma Whole Europe Index, we can also notice the market is losing part of its momentum. We can also notice the rebound was much smaller than in the US. On top of that, it seems that recent rebound looks like an 'abc' pattern (not a perfect one, but it could work). So, we are more cautious on Europe.

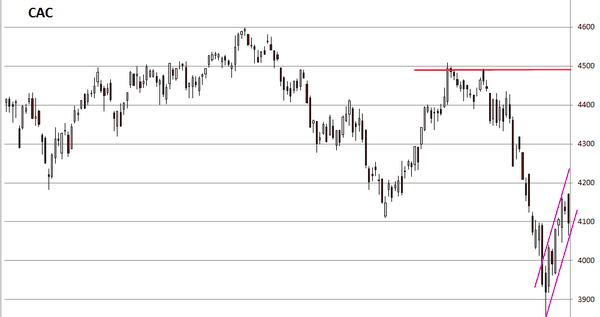
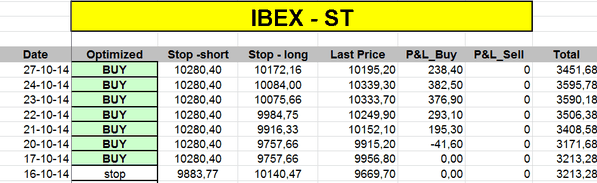
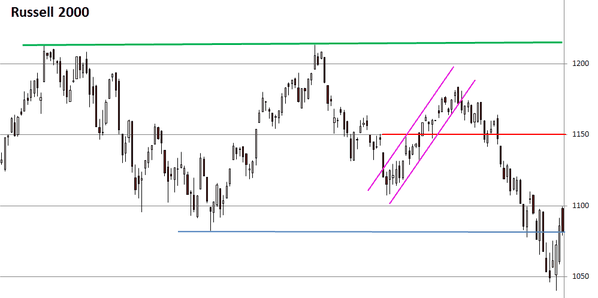
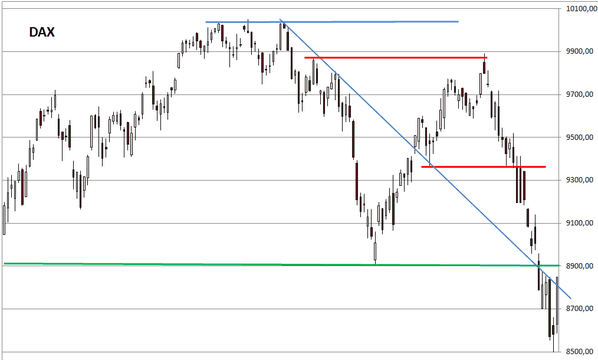
Looking at some key European indexes, we can also notice that they are not far from key supports. So, any reversal from here could do some major damages.


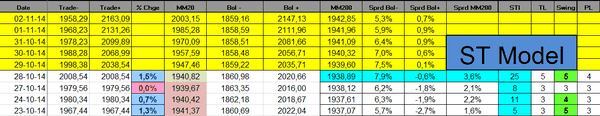
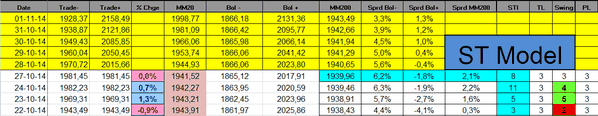
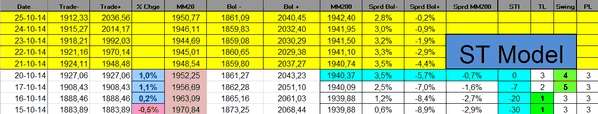
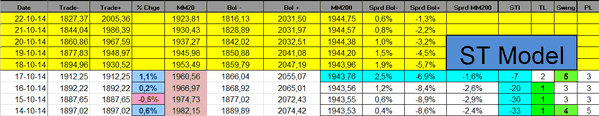
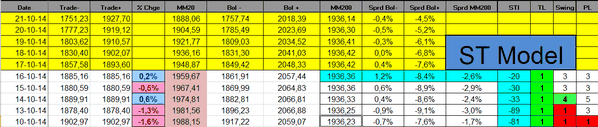
The Sigma trend Index sharply declined to '15'.Other indicators were neutral (at '3')

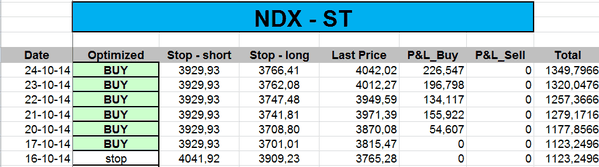
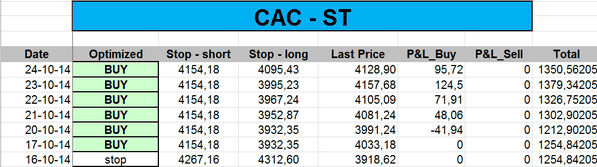
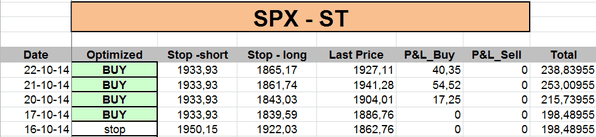
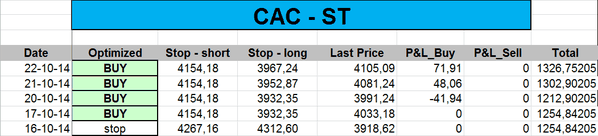
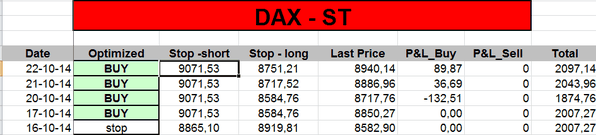
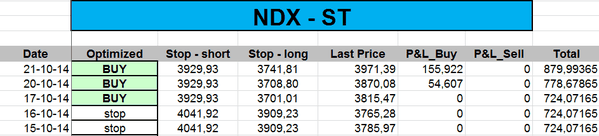
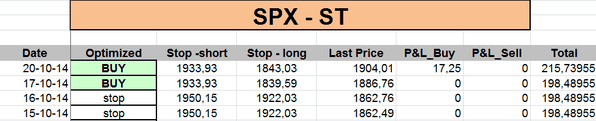
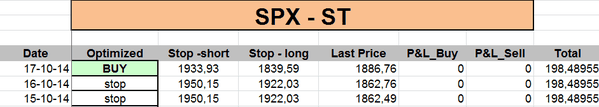
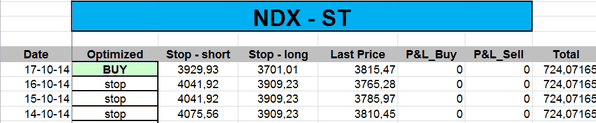
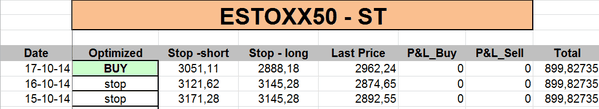
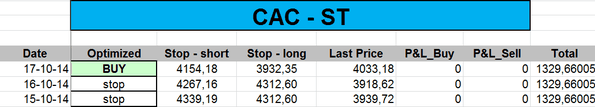
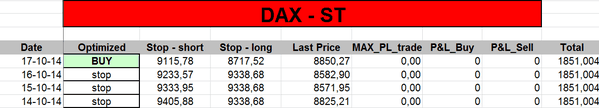
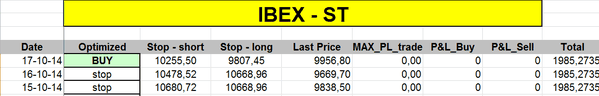
The ST model uplifted some of its stops:

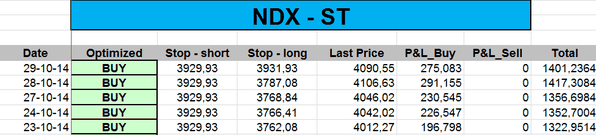

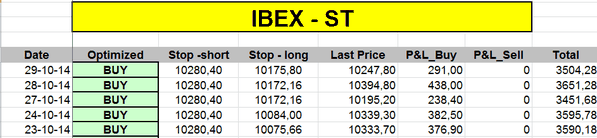
Short Term Trading Book: