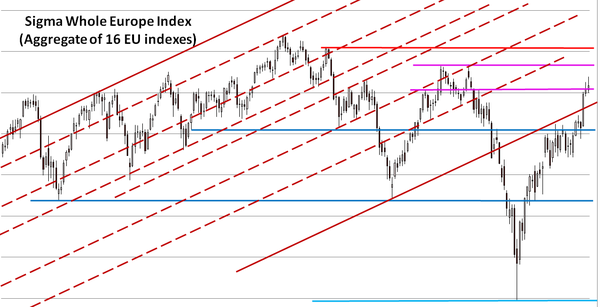
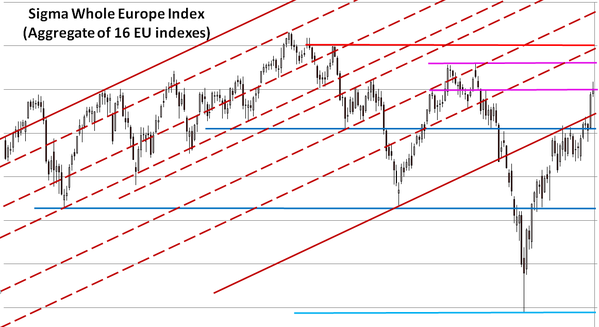
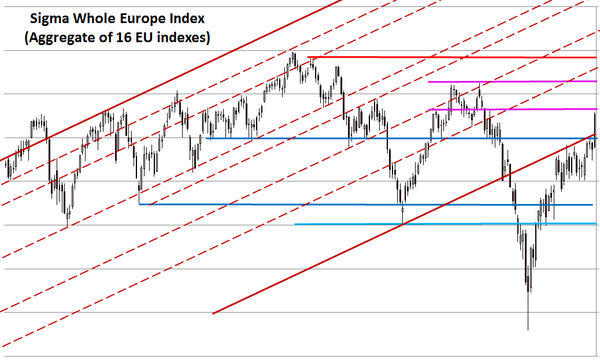
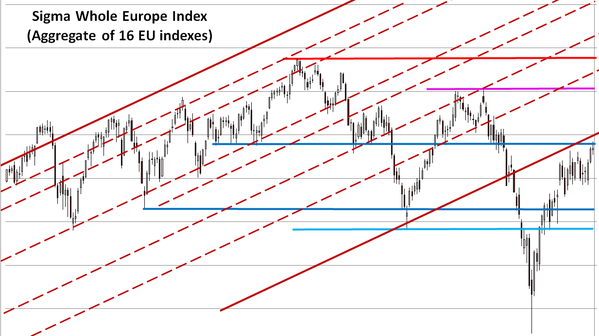
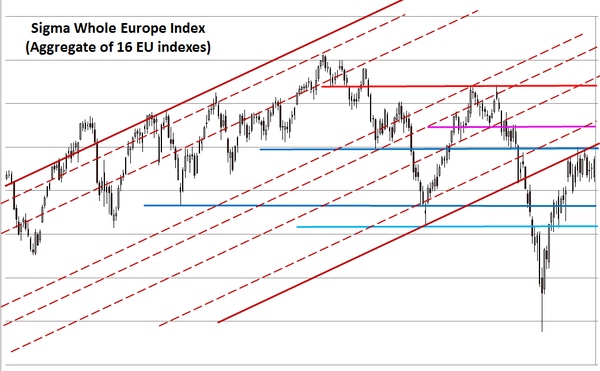
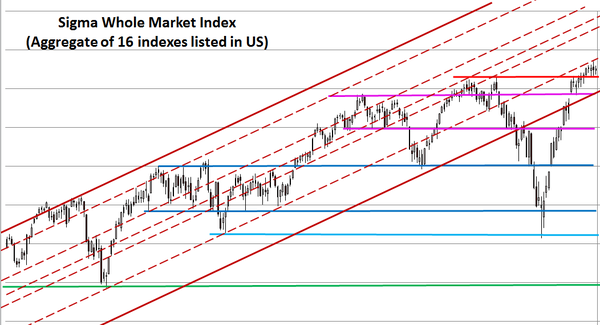
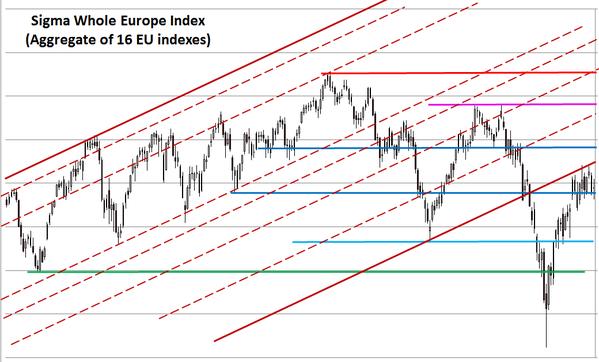
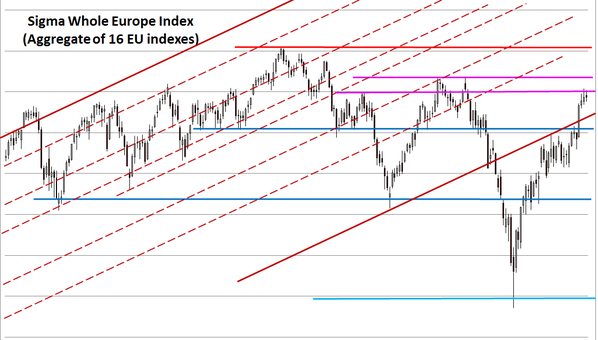
The Sigma Whole Europe Index remains stuck below its (pink) horizontal resistance. The market started a consolidation at elevated level.
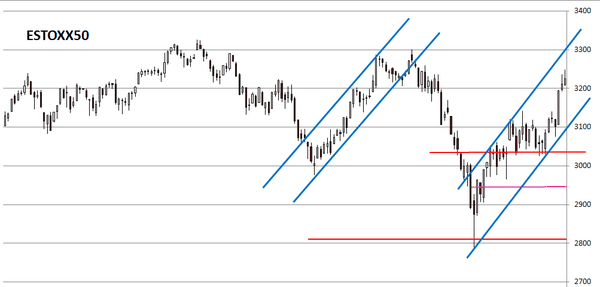
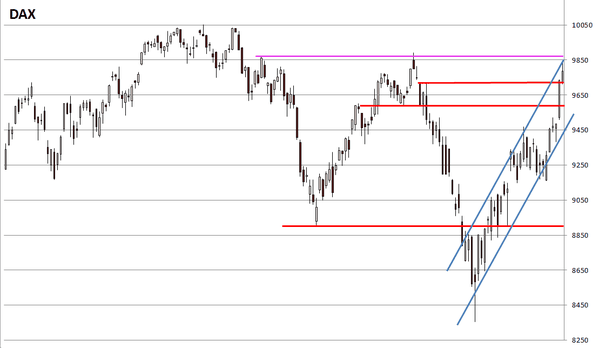
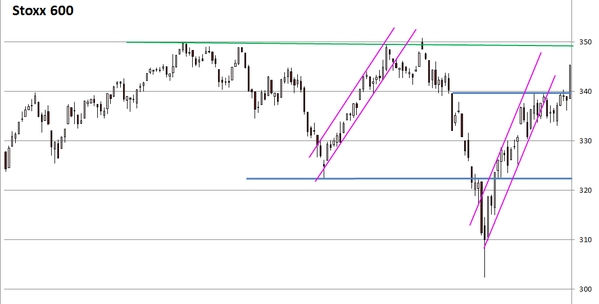
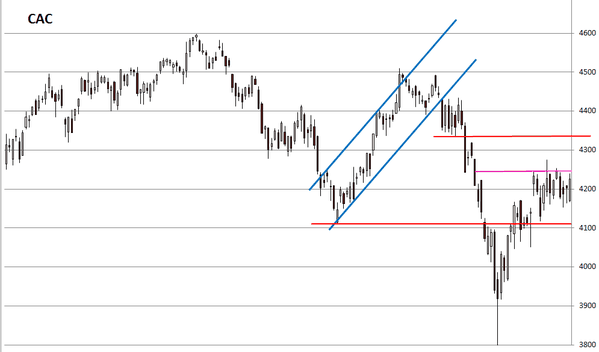
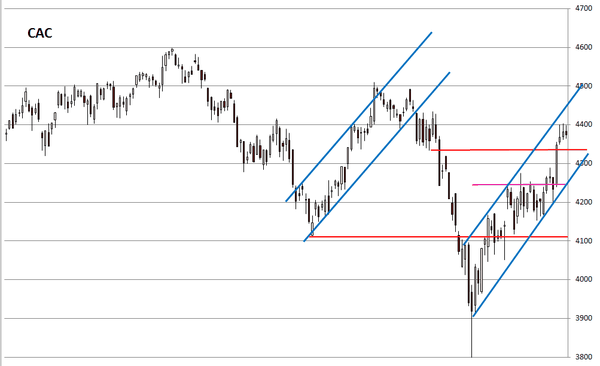
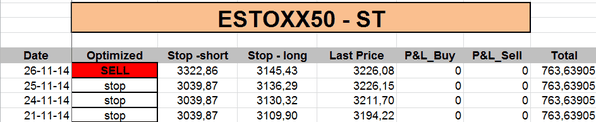
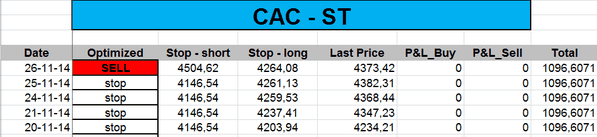
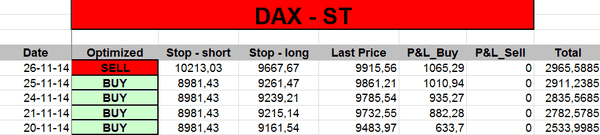
Looking at some key European charts, the consolidation is also very clear: CAC seems unable to move above 4400 and EuroStoxx has the problem with the 3250 area. The DAX continued its impressive advance.


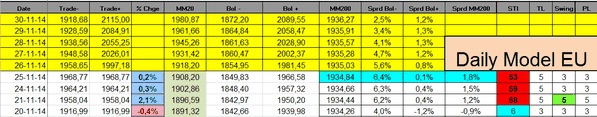
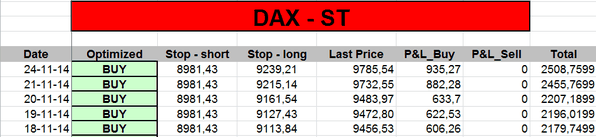
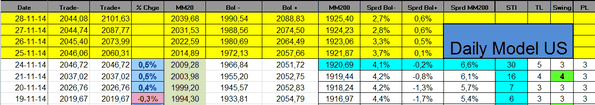
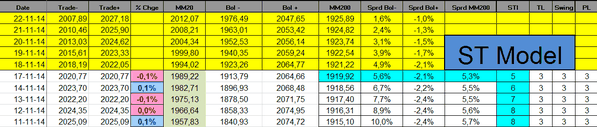
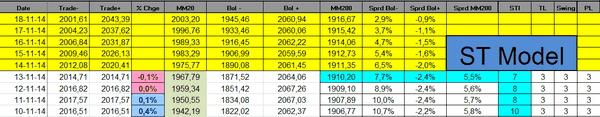
The Power Level dropped to '2' on Wednesday, generating a confirmed sell signal in Europe.
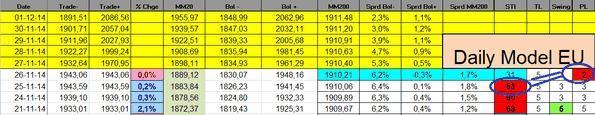
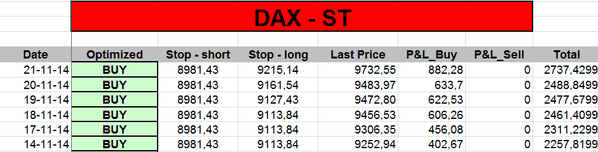
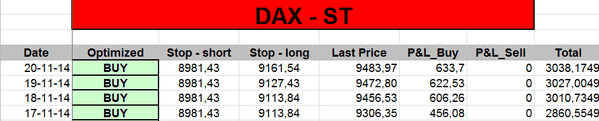
The ST model is now short on European indexes:

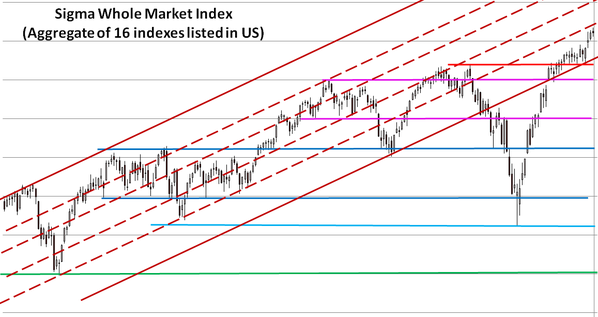
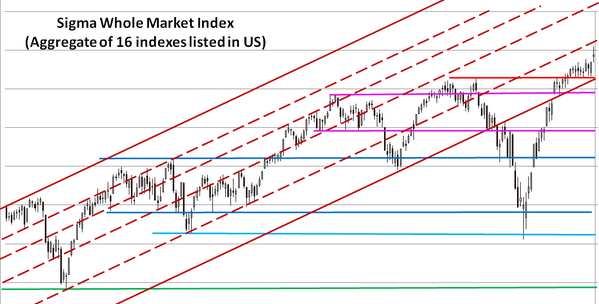
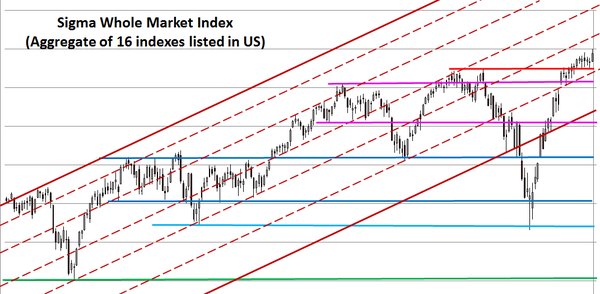
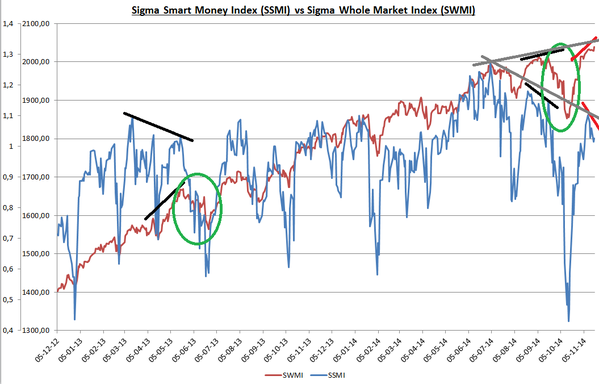
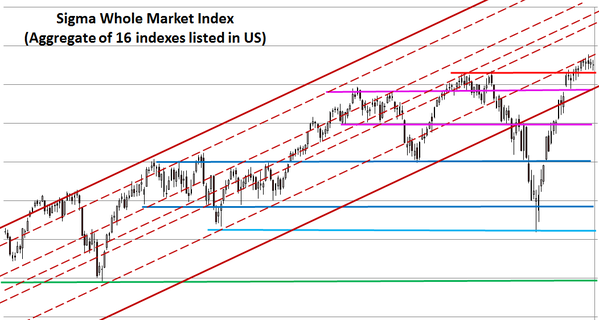
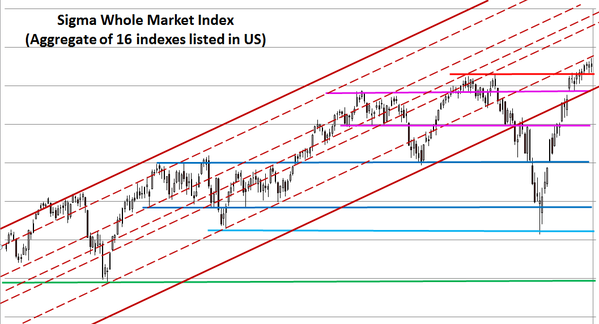
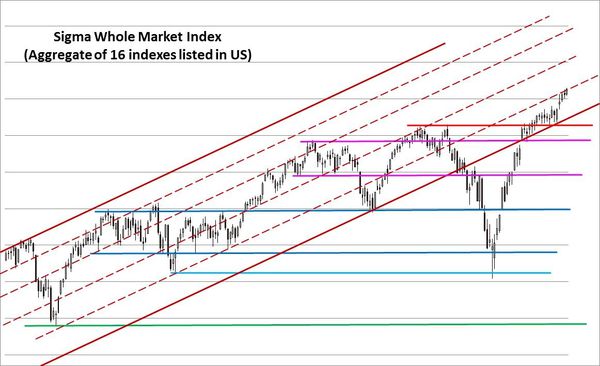
The Sigma Whole Market Index continues its advance, the world is beautiful and thanks to central banks, it is always Xmas in United states...
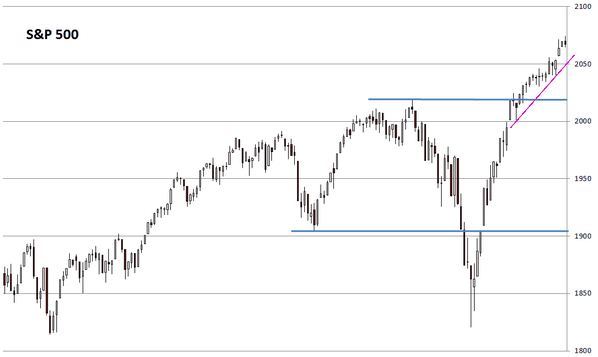
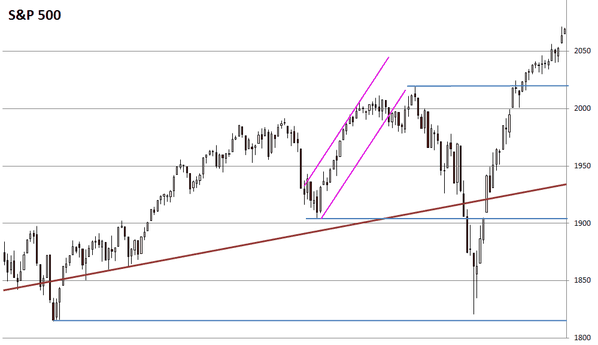
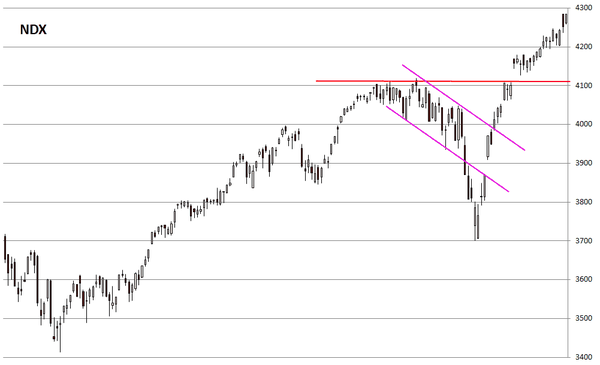
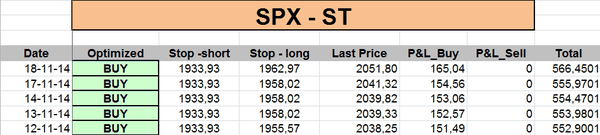
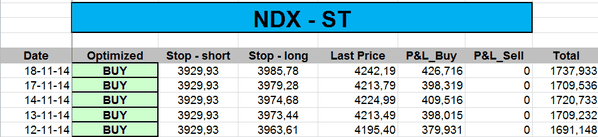
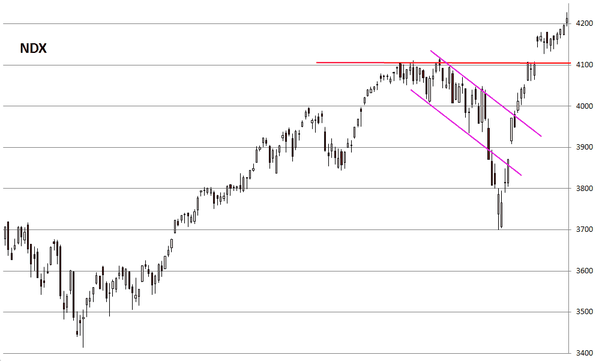
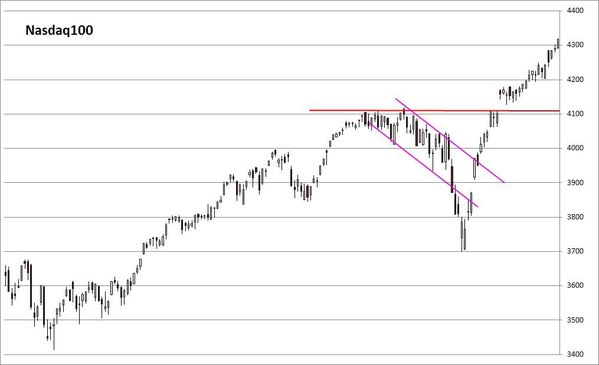
Both the NDX and the SPX continue to print new record highs. It seems the NDX wants to retest its 2000 record high.

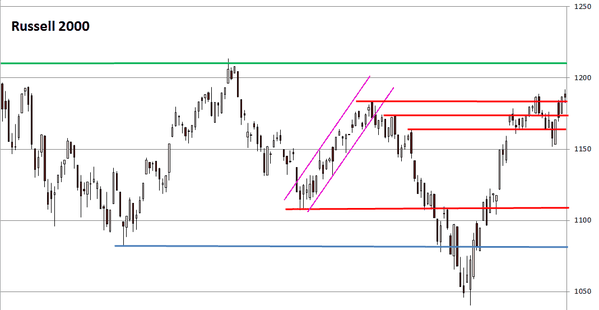
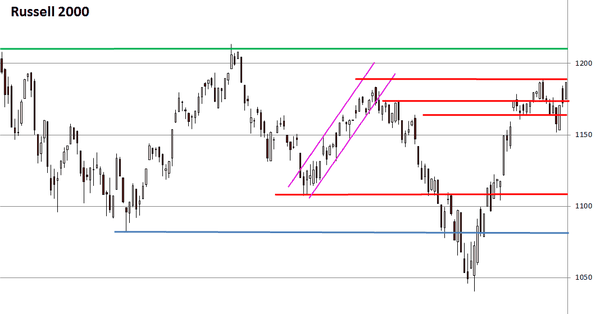
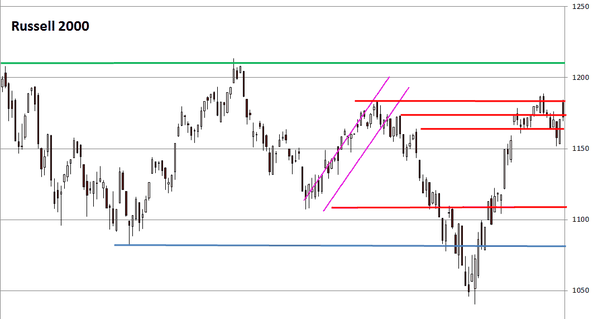
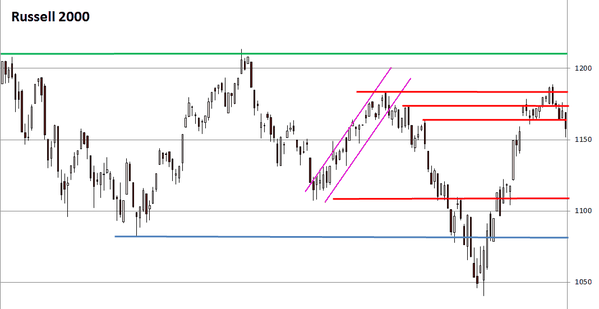
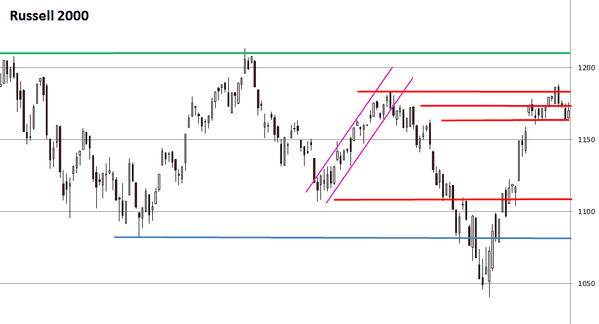
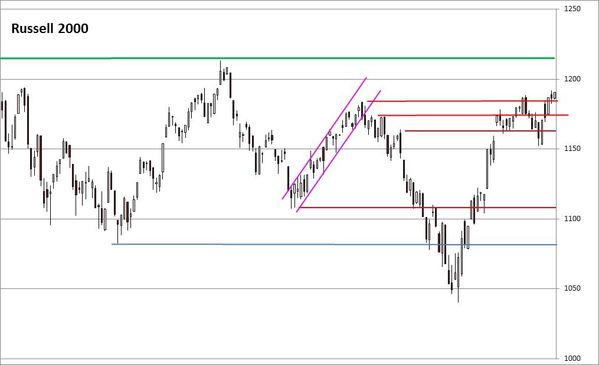
But the Russell 2000 is still more than 1% below its 52weeks high.
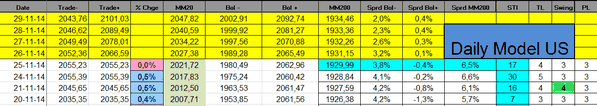
The Sigma Trend Index remains below '34'. So, we can't get any sell signal at this time.
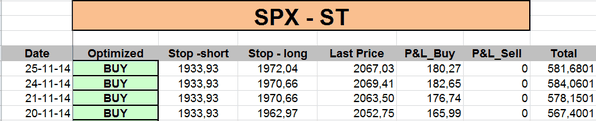
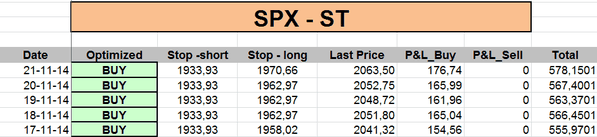
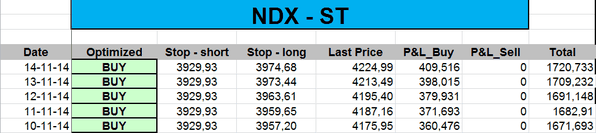
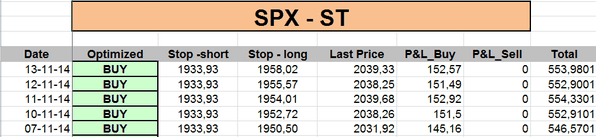
The ST model uplifted its stop on the NDX:

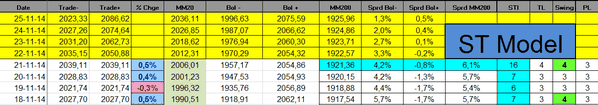
Short Term Trading Book: