


The Sigma Whole Europe Index had a volatile day: the market had initially been under heavy selling pressure but in the last 2 hours of the trading session, the market enjoyed a powerful rally and closed well in positive territory.
This could be a reversal day but when the market is so oversold, a powerful rally doesn't necessarily mean a reversal day.
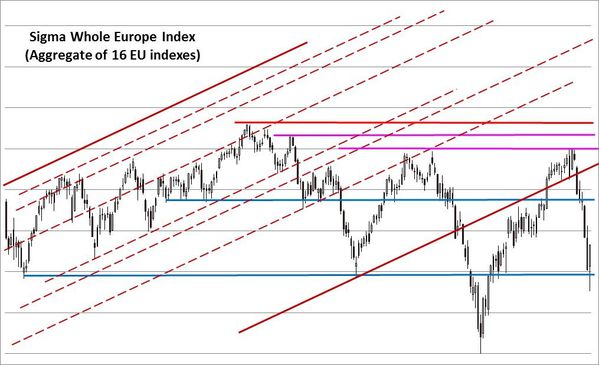
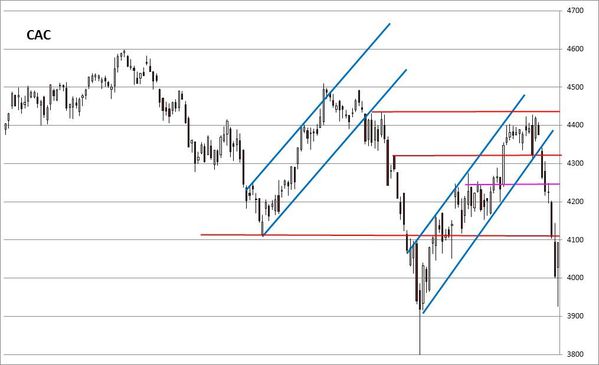
Looking at key European indexes, we can see the same pattern than on the Sigma Whole Europe Index: a new sell off followed by a strong rally.


Looking at our indicators, the Sigma Trend Index strongly bounced back from '-153' to '-29. The Swing came in at '5' telling the rally was highly impulsive but as the STI was below '-125' (free fall level), the ST model didn't generate a 'buy' signal.
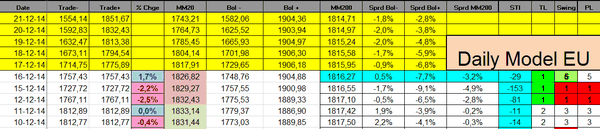
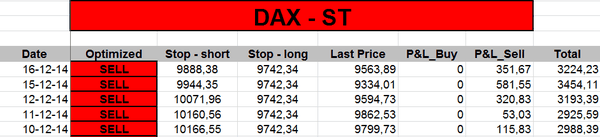
The ST model lowered its stop levels on all European positions:


The Sigma Whole Market Index continues to slide and the pattern is the exact opposite from the European one: after a weak start, the market enjoyed a strong rally during the first hours of trading followed by a new sell off at the end of the session. So, this sounds rather bearish, once again.

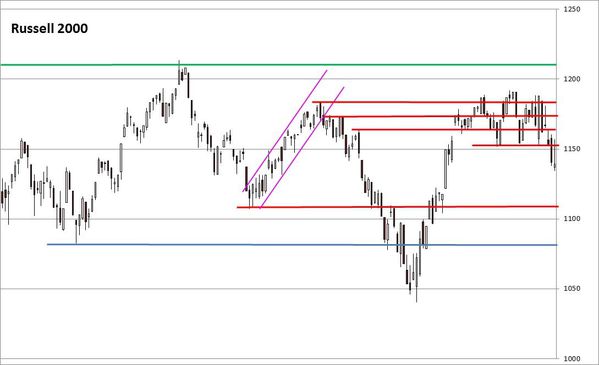
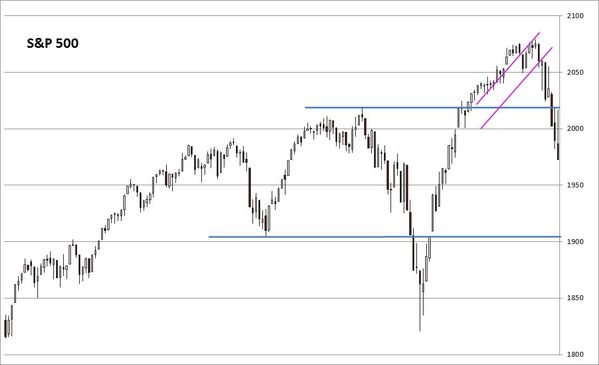
Looking at key US indexes, we can notice that all of them are now below major supports. Even the Nasdaq100 broke its horizontal support. Based on those charts, it seems that more selling pressure is on the agenda.


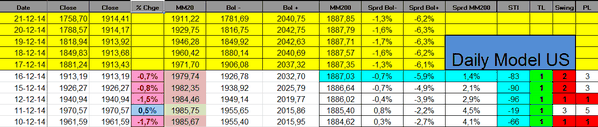
Looking at our indicators the Sigma Trend Index remains in negative territory but there is no capitulation sign coming from the Trend Level(TL) or the Swing indicator.
The SPX index declined below our stop level. So we closed our long position and booked our gains:
1971.86 - 1892.65 = 79.21 (gains)
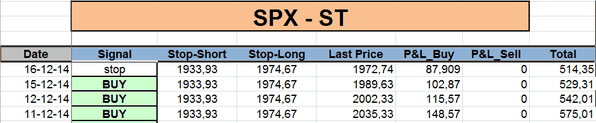
Short Term Trading Book:


