Overblog
Editer l'article Suivre ce blog Administration + Créer mon blog
8 janvier 2015 4 08 /01 /janvier /2015 09:03
Europe:

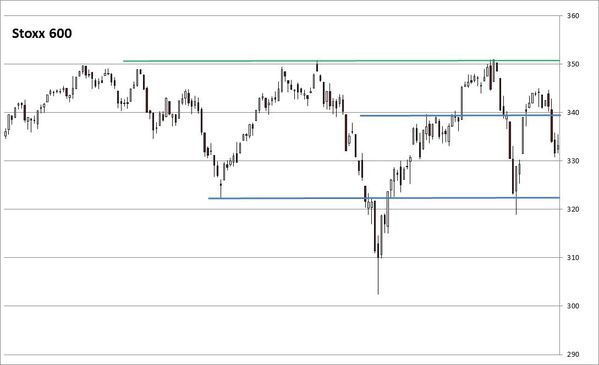
The Sigma Whole Europe Index had a small bounce back on Wednesday. Nevertheless it is impossible to say at this stage if it is just a bounce back in a downtrend or if it is the end of the "correction".


EU-Daily-Chart_SWEU_20150108.jpg


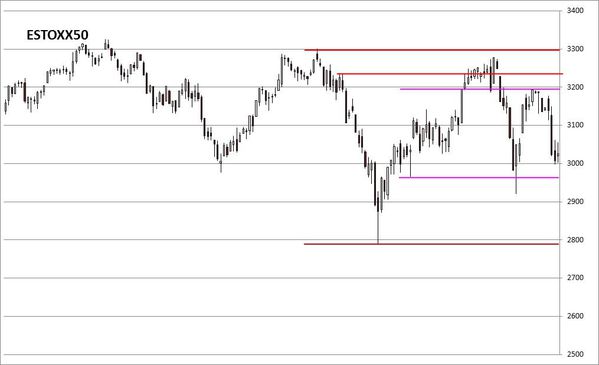
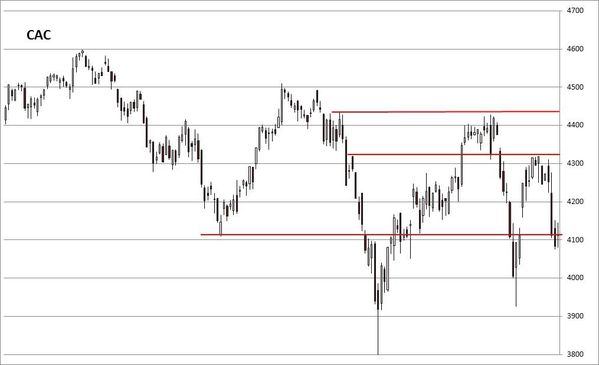
Looking at key EU indexes, we can notice that December's gaps were closed but there is no sign the correction is over: a retest of the next horizontal support seems more likely on a 10 days basis but a short term bounce back remains possible.


EU-Daily-ChartSTOXX600_20150108.jpg

EU-Daily-ChartESTOXX_20150108.jpg

EU-Daily-ChartDAX_20150108.jpg

EU-Daily-ChartCAC_20150108.jpg


The Sigma Trend Index remains in negative territory, all other indicators are neutral at '3'.


steumodel20150107.PNG


United States:

The Sigma Whole Market Index enjoyed a strong bounce back and it is right below the pink resistance. The red ascending line acted twice as a support, this line will be important to monitor.


US-Daily-Chart-Candle_20150108.jpg


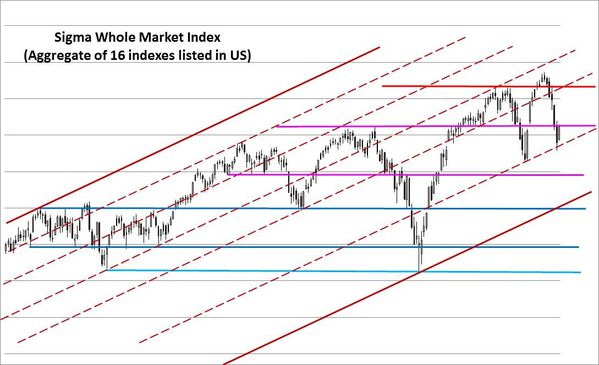
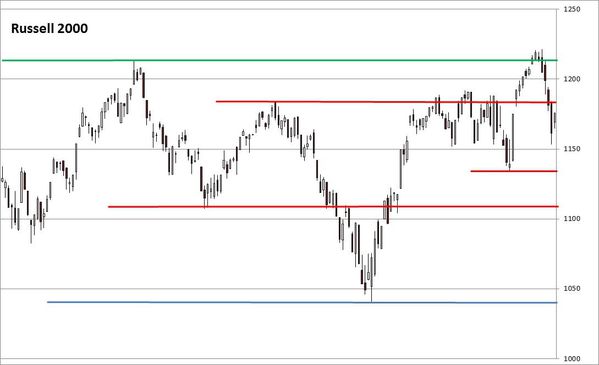
Looking at key indexes, we can notice the 4100 level is very important for the NDX. On other indexes, we are between support and resistance, so it is very difficult to have a clear opinion here.

The best thing to do is (probably) to monitor the NDX: as long as it remains above '4100', it is ok but if it closes below this level, this is a very bad signal.


US-Daily-ChartNDX_20150108.jpg

US-Daily-ChartSP500_20150108.jpg

US-Daily-ChartRUT_20150108.jpg

US-Daily-ChartMID_20150108.jpg


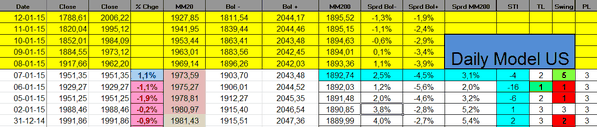
The Sigma Trend Index is now at '-4', not far from its zero line. It will be interesting to see if it can move in positive territory.

The Swing came in at '5'. As the Trend Level (TL) was at '1' on Tuesday, this means the ST model generated a fresh buy signal on US markets.

It is not a question to know if we are convinced or not by this signal but we are focused on our model, and discipline is key in trading. Feeling and sentiment is your worst enemy.


stmodel20150107.PNG


stspx20150107.PNG


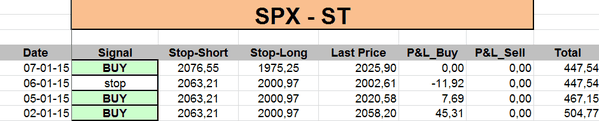
So, we bought 1 SPX at 2026.41


Daily Trading Book: 

- SPX: long at 2026.41 (stop @ 1972, 3pts below the ST model to take into account bid/ask spread)
- NDX: long at 4236.28 (2014's close) (stop @ 4035, 5pts below the ST model to take into account bid/ask spread)
- CAC: stopped
- EuroStoxx50: stopped
- DAX:  stopped
- IBEX: stopped
Partager cet article
Repost0

commentaires

Presentation

  • : Le blog de sigmatradingoscillator
  • : Professionnel de la finance de marché depuis plus de 10ans, j'ai mis au point une série d'outils de trading me permettant de prendre et couper mes positions. Ici, j'écris un update quotidien sur la situation du CAC,DAX, Eurostoxx, SP500, Nasdaq100. Attention Les éléments repris dans ce blog représentent uniquement mon opinion personnelle et ne constituent en aucun cas une incitation au trading ou du conseil financier. Pour du conseil, consultez votre conseiller en placement
  • Contact

Disclaimer

NO MATERIAL HERE CONSTITUTES "INVESTMENT ADVICE" NOR IS IT A RECOMMENDATION TO BUY OR SELL ANY FINANCIAL INSTRUMENT, INCLUDING BUT NOT LIMITED TO STOCKS, COMMODITIES, OPTIONS, BONDS, FUTURES, OR BULLION. ACTIONS YOU UNDERTAKE AS A CONSEQUENCE OF OUR ANALYSIS, OPINION OR ADVERTISEMENT ON THIS SITE ARE YOUR SOLE RESPONSIBILITY.

FOR INVESTMENT ADVICE, PLAN A MEETING WITH A FINANCIAL ADVISOR IN ORDER TO ESTABLISH YOUR OWN RISK PROFILE.

Archives

Pages