Overblog
Editer l'article Suivre ce blog Administration + Créer mon blog
22 janvier 2015 4 22 /01 /janvier /2015 09:33
Europe:

The Sigma Whole Europe Index was able to move above the first pink horizontal resistance. There is a high probability the market could test the red horizontal resistance on the ECB' decision. In order to open the way for further gains, we need a close above the red horizontal resistance.


EU-Daily-Chart_SWEU_20150122.jpg


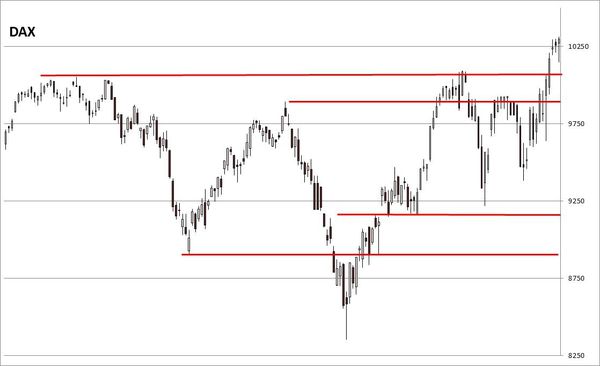
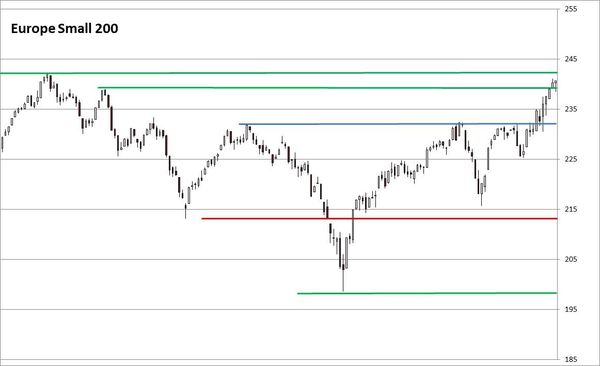
Looking at key EU indexes, we can see various situations: some indexes are printing new highs while other indexes remain in the middle of their trading range.


EU-Daily-ChartDAX_20150122.jpg

EU-Daily-ChartEUSMALL200_20150122.jpg

EU-Daily-ChartSTOXX600_20150122.jpg

EU-Daily-ChartFTSE_20150122.jpg

EU-Daily-ChartIBEX_20150122.jpg


The Sigma Trend Index Europe remains above the key '34' level. So, any impulse move to the downside in the next 3 sessions will trigger a 'sell' signal. The 5 latest sessions were impulsive, this is rather unusual: either we are at the early stage of a major move or we are in a capitulation situation. But the rally is so extended on a short term basis that we believe a sell on news (after the ECB's decision) is likely.


steumodel20150121.PNG


United States:

The Sigma Whole Market Index remains above a strong horizontal resistance but recent action is not really convincing for a bull run. It seems we could be in a counter trend move.


US-Daily-Chart_SWM_20150122.jpg


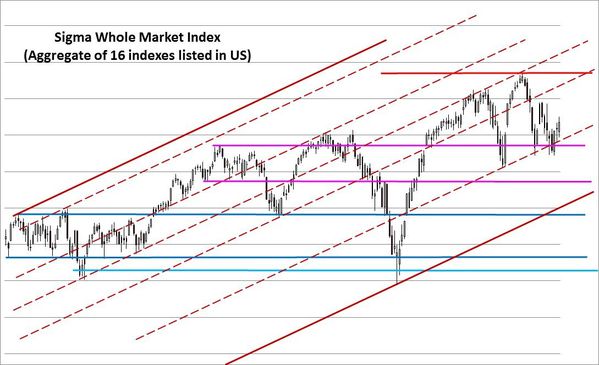
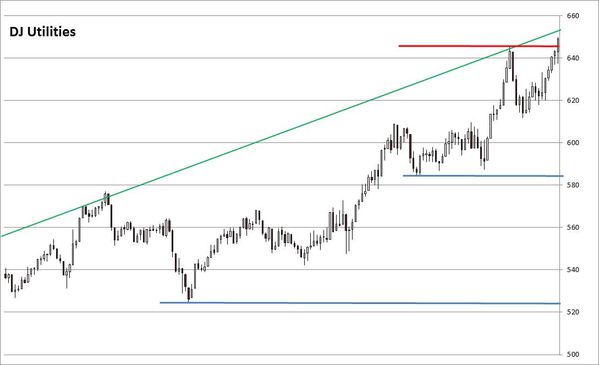
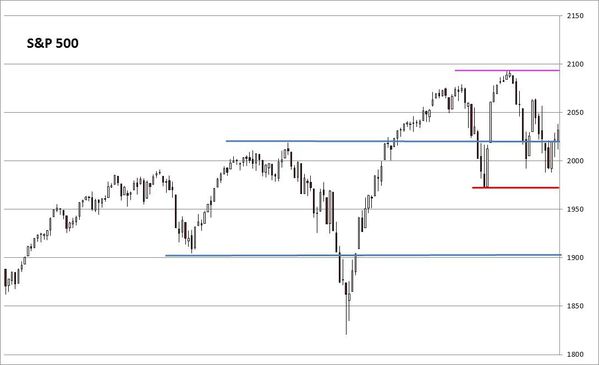
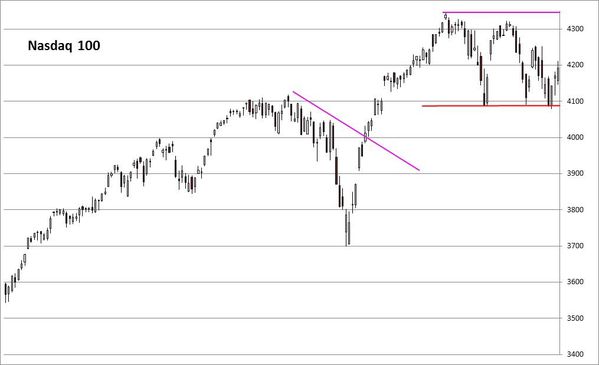
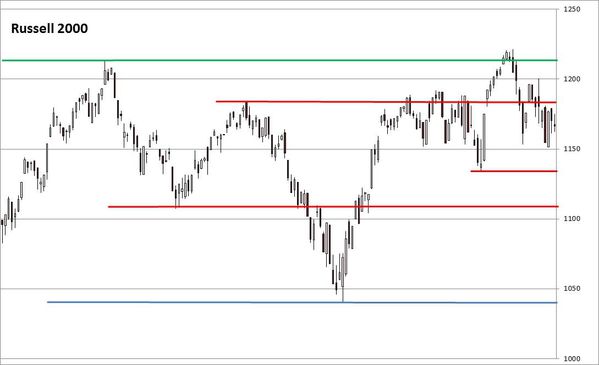
Looking at key indexes, we have roughly the same situation than in Europe: some indexes are close to their recent top while others remain in the middle of their recent trading range.


US-Daily-ChartDJU_20150122.jpg

US-Daily-ChartDJI_20150122.jpg

US-Daily-ChartSP500_20150122.jpg

US-Daily-ChartNDX_20150122.jpg

US-Daily-ChartRUT_20150122.jpg


The Sigma Trend Index is testing its zero line. So, US markets are not out of the wood, recent action could have been a technical rebound.
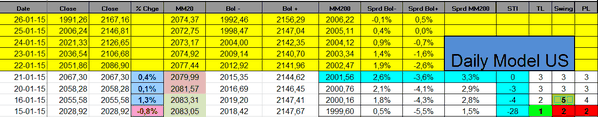
 

stmodel20150121.PNG


Daily Trading Book: 

- SPX: stopped
- NDX: long at 4236.28 (2014's close) (stop @ 4035, 5pts below the ST model to take into account bid/ask spread)
- CAC: stopped
- EuroStoxx50: stopped
- DAX:  stopped
- IBEX: stopped


Partager cet article
Repost0

commentaires

Presentation

  • : Le blog de sigmatradingoscillator
  • : Professionnel de la finance de marché depuis plus de 10ans, j'ai mis au point une série d'outils de trading me permettant de prendre et couper mes positions. Ici, j'écris un update quotidien sur la situation du CAC,DAX, Eurostoxx, SP500, Nasdaq100. Attention Les éléments repris dans ce blog représentent uniquement mon opinion personnelle et ne constituent en aucun cas une incitation au trading ou du conseil financier. Pour du conseil, consultez votre conseiller en placement
  • Contact

Disclaimer

NO MATERIAL HERE CONSTITUTES "INVESTMENT ADVICE" NOR IS IT A RECOMMENDATION TO BUY OR SELL ANY FINANCIAL INSTRUMENT, INCLUDING BUT NOT LIMITED TO STOCKS, COMMODITIES, OPTIONS, BONDS, FUTURES, OR BULLION. ACTIONS YOU UNDERTAKE AS A CONSEQUENCE OF OUR ANALYSIS, OPINION OR ADVERTISEMENT ON THIS SITE ARE YOUR SOLE RESPONSIBILITY.

FOR INVESTMENT ADVICE, PLAN A MEETING WITH A FINANCIAL ADVISOR IN ORDER TO ESTABLISH YOUR OWN RISK PROFILE.

Archives

Pages