Overblog
Suivre ce blog Administration + Créer mon blog
20 décembre 2013 5 20 /12 /décembre /2013 08:00

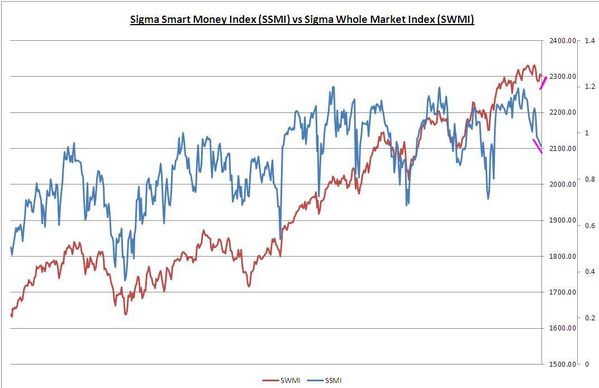
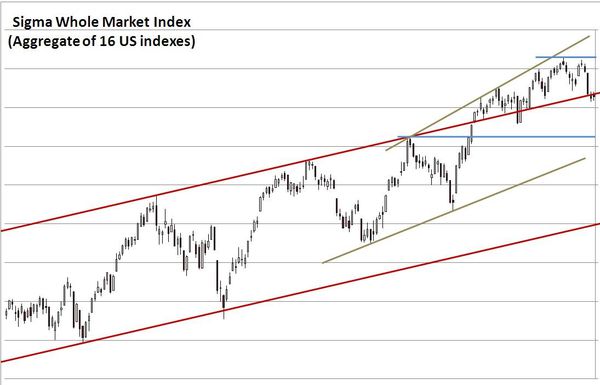
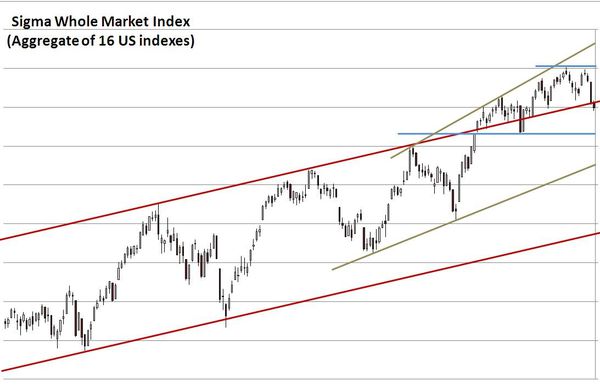
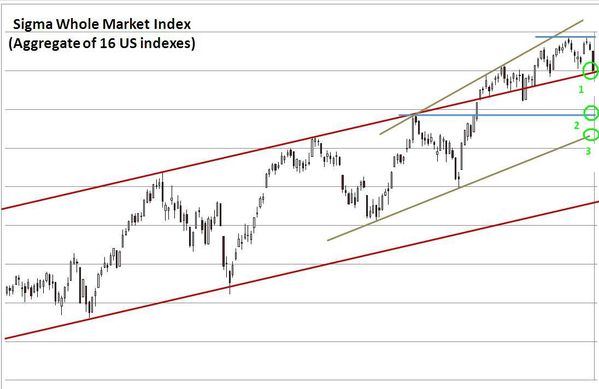
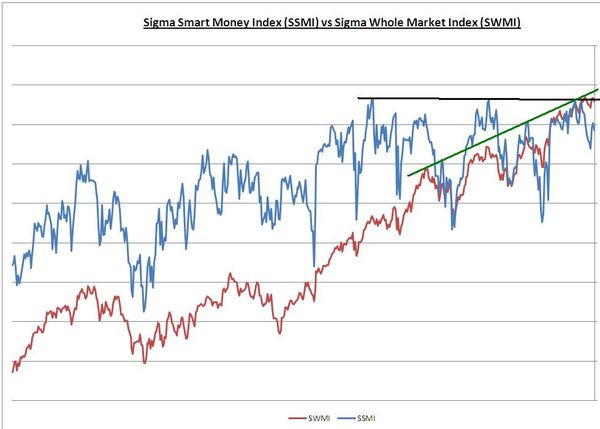
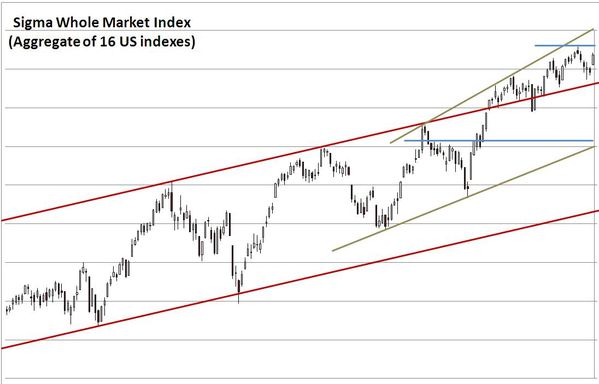
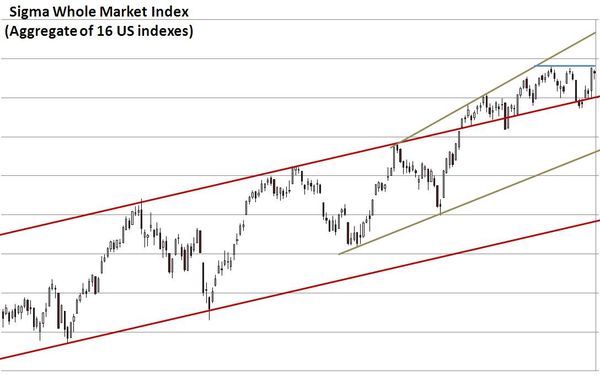
Looking at the chart of the Sigma Whole Market Index, it is very clear we are ready to break previous highs (very bad if we can't due to a triple top situation !!!!!! ). If the market is able to clean this resistance, we will be (again) in uncharted territory and euphoria can easily materialize in this area.


usmarket20131219.JPG


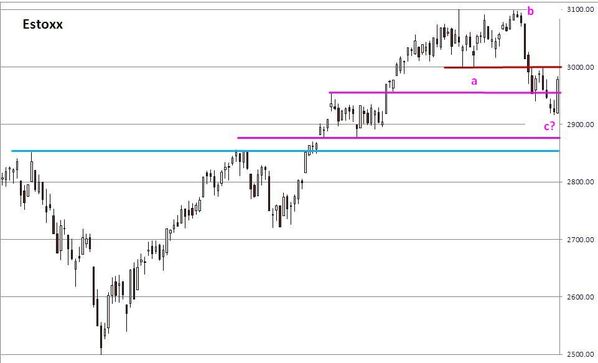
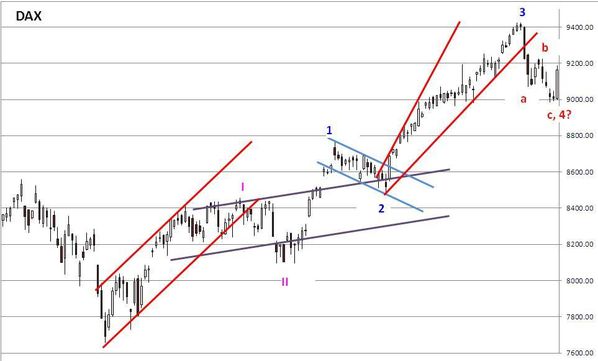
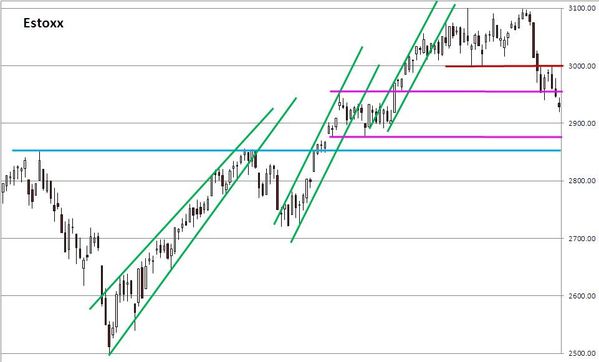
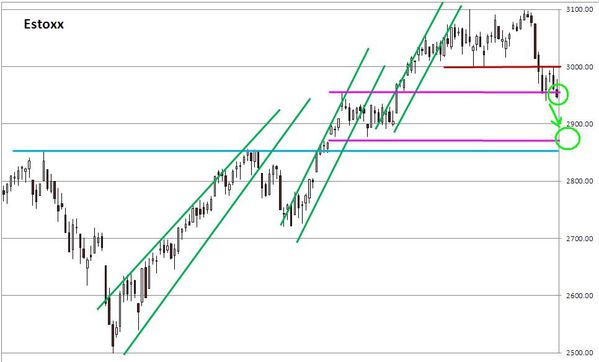
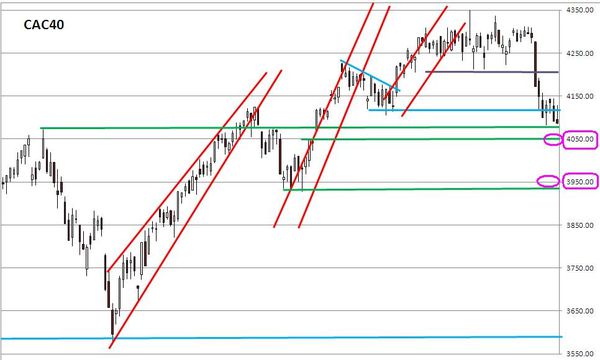
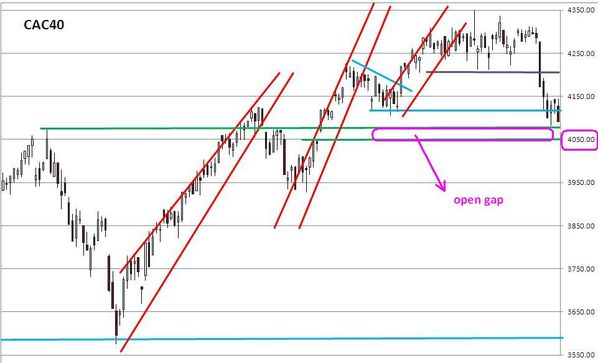
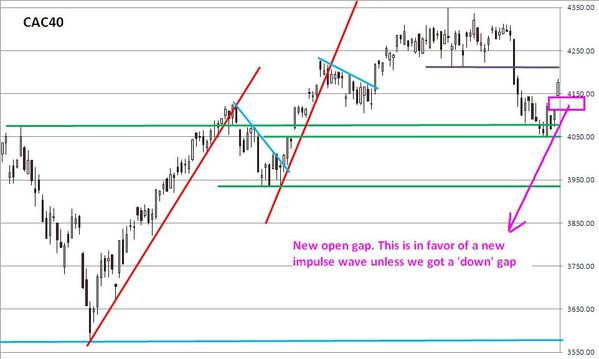
The situation in Europe is also very positive with fresh bullish gaps on all indexes. The DAX and the Eurostoxx are more advance than the CAC40, and we would not be surprised to see new 52weeks highs on those 2 indexes. Nevertheless, a 'fresh down gap' would cancel this bullish scenario.


chartestox20131219.JPG

chartdax20131219.JPG

chartcac20131219.JPG


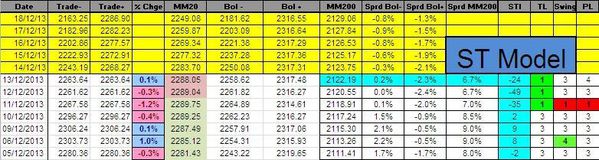
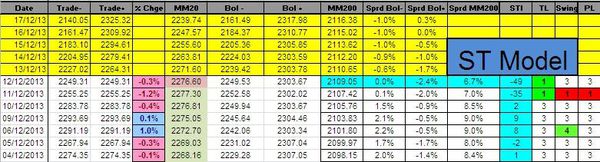
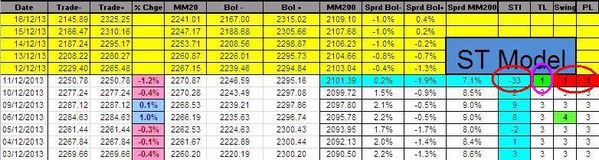
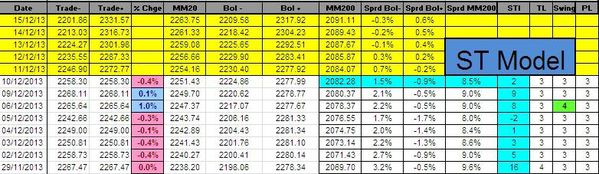
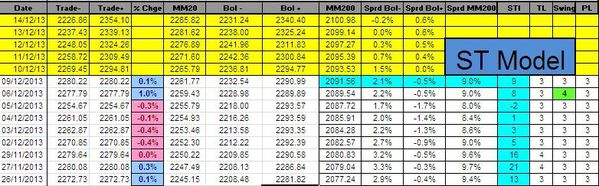
There is no new information coming from our indicators for today:stmodel20131219.JPG


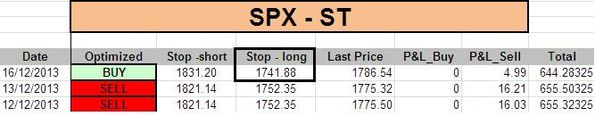
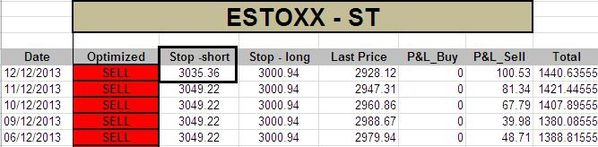
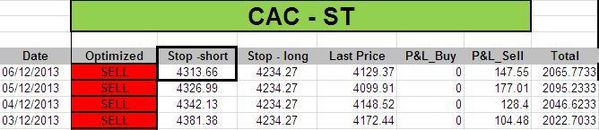
The ST model computed new stop levels for the DAX, CAC and Eurostoxx:


stcac20131219.JPG

stdax20131219.JPG

stestox20131219.JPG


Short Term Trading Book:


- SPX: long at 1787.18 (stop @ 1748, 3pts below the ST model to take into account bid/ask spread)

- NDX: long at 3475.53 (stop @ 3372, 5pts below the ST model to take into account bid/ask spread)

- CAC: long at 4115.38 (stop @ 4055, 5pts below the ST model to take into account bid/ask spread)

- DAX: long at 9164.04 (stop @ 8890, 10pts below the ST model to take into account bid/ask spread)

- EStoxx: long at 2974.13 (stop @ 2900, 5pts below the ST model to take into account bid/ask spread)


Medium Term Trading Book:


- No more medium term position at this stage.


Out of model position: (in case of a blow off rally like in 2000)


- 1 call NDX January 2014 strike 3700 @ 5.06

Partager cet article
Repost0
19 décembre 2013 4 19 /12 /décembre /2013 07:52

Lookng at Wednesday's candle, there is no doubt that Wednesday's session was an impulse day. The market is just below its historical high and it is well placed for printing new highs in coming sessions.


usmarket20131218-copie-1.JPG


Looking at freshly released sentiment data , we notice a pick up in 'bull' sentiment but we are still well below 2000's levels. So , it remains more room before we reach euphoria levels.


aaii20131218


Looking at our indicators, there is no doubt that Wednesday was a strong impulse day. The Sigma Trend Index jumped back in positive territory, the swing surge to '5' and the Power Level was at '4'.


stmodel20131218


The ST model computed new stop levels for both the SPX and the NDX:


stspx20131218

stndx20131218


Short Term Trading Book:


- SPX: long at 1787.18 (stop @ 1748, 3pts below the ST model to take into account bid/ask spread)

- NDX: long at 3475.53 (stop @ 3372, 5pts below the ST model to take into account bid/ask spread)

- CAC: long at 4115.38 (stop @ 4032, 5pts below the ST model to take into account bid/ask spread)

- DAX: long at 9164.04 (stop @ 8808, 10pts below the ST model to take into account bid/ask spread)

- EStoxx: long at 2974.13 (stop @ 2856, 5pts below the ST model to take into account bid/ask spread)


Medium Term Trading Book:


- No more medium term position at this stage.


Out of model position: (in case of a blow off rally like in 2000)


- 1 call NDX January 2014 strike 3700 @ 5.06

Partager cet article
Repost0
18 décembre 2013 3 18 /12 /décembre /2013 07:57

The Sigma Whole Market Index slightly pulled back after the strong impulse day we had on Monday. The market remains above the top of the red uptrend . There is nothing special at this stage.

Once again, the catalyst for the next move will be a political event: Fed's decision related to "taper or not taper". I've to admit the market acts more and more like a communist central plan rather than a free market: I mean the biggest drivers of the market in recent years had been: Merkel, Draghi, Bernanke, Boehner.... and not earnings, growth, valuation, free cash flow, ... After the "new economy" in 1998-2000 we have "the subsidised" economy in 2012-2013...


usmarket20131217.JPG


Nevertheless, it remains one warning signal in place: the Sigma Smart Money Index continues to decline, and it didn't bounce back on Monday (as can be seen on the chart).


ssmi20131217.JPG


There is no change in our indicators. The Trend Level (TL) pulled back from '3' to '2'. (neutral to negative)


stmodel20131217.JPG


Short Term Trading Book:


- SPX: long at 1787.18 (stop @ 1739, 3pts below the ST model to take into account bid/ask spread)

- NDX: long at 3475.53 (stop @ 3367, 5pts below the ST model to take into account bid/ask spread)

- CAC: long at 4115.38 (stop @ 4032, 5pts below the ST model to take into account bid/ask spread)

- DAX: long at 9164.04 (stop @ 8808, 10pts below the ST model to take into account bid/ask spread)

- EStoxx: long at 2974.13 (stop @ 2856, 5pts below the ST model to take into account bid/ask spread)


Medium Term Trading Book:


- No more medium term position at this stage.


Out of model position: (hedge against a blow off rally like in 2000)


- 1 call NDX January 2014 strike 3700 @ 5.06


Partager cet article
Repost0
17 décembre 2013 2 17 /12 /décembre /2013 07:52

We wrote during the week-end that the market was in danger. The market decided to bounce back and Monday's move sounds like a positive impulse day in Europe while the bounce back is more muted in US.

The Sigma Whole Market Index was able to move back above the top of the red uptrend channel and this is another positive sign.

So, the big question is: Was it an 'abc' correction? Is this correction already over?


usmarket20131216.JPG

When we look at European indexes, the bounce back looks like an impulse move: in one session, the market was able to retrace several days of decline. On top of that, it is clearly possible to count recent decline as an 'abc' move.


chartcac20131216.JPG

chartestox20131216.JPG

chartdax20131216-copie-1.JPG


Looking at our indicators, the Swing jumped to '4' while the TL had been at '1' during a couple of session. So, the ST model generated a fresh 'buy' signal. (for more details on our methodology, click on 'methodology' in the right column)


stmodel20131216.JPG


So, we closed our short positions and opened long positions at the end of US session:

- 1 short CAC closed at 4115.38 => 4272.14 - 4115.38 = 156.76 (gains)

- 1 short EuroStoxx closed at 2974.13 => 3027.17 - 2974.13 = 53.04 (gains)

- 1 short SPX closed at 1787.18 => 1792.26 - 1787.18 = 5.08 (gains)


stspx20131216.JPG

stndx20131216.JPG

stcac20131216.JPG

stdax20131216.JPG

stestox20131216.JPG


Short Term Trading Book:


- SPX: long at 1787.18 (stop @ 1739, 3pts below the ST model to take into account bid/ask spread)

- NDX: long at 3475.53 (stop @ 3367, 5pts below the ST model to take into account bid/ask spread)

- CAC: long at 4115.38 (stop @ 4032, 5pts below the ST model to take into account bid/ask spread)

- DAX: long at 9164.04 (stop @ 8808, 10pts below the ST model to take into account bid/ask spread)

- EStoxx: long at 2974.13 (stop @ 2856, 5pts below the ST model to take into account bid/ask spread)


Medium Term Trading Book:


- No more medium term position at this stage.


Out of model position: (hedge against a blow off rally like in 2000)


- 1 call NDX January 2014 strike 3700 @ 5.06

Partager cet article
Repost0
16 décembre 2013 1 16 /12 /décembre /2013 07:08

The Sigma Whole Market Index enjoyed a low vlolatility day on Friday. The index remains below a strong resistance (top of the uptrend channel) and the next support is well below current level. The market is in danger at this time.


usmarket20131213.JPG


Looking at the CAC40, the index closed the gap and is now on a strong support. If this support can't resist, the next support is around 3940 (~ 3% below Friday's close).


chartcac20131213.JPG


The Eurostoxx recently broke its first support and the next one is well below current levels (~ 2%). This index is facing the risk of a downside acceleration.


chartestox20131213.JPG


The Sigma Smart Money Index (SSMI) continues to decline and a clear downtrend channel is now in place. Once again, the negative divergence between the SSMI and the SWMI was a key warning signal for investors.


ssmi20131212.JPG


Looking at other indicators, the trend Level is at '1' so there is no doubt that the market is (short term) oversold.


stmodel20131213.JPG


The ST model computed new stop levels for the SPX, the CAC and the Eurostoxx:


stspx20131212.JPG

stcac20131213.JPG

stestox20131213.JPG


Short Term Trading Book:


- SPX: short at 1792.26 (stop @ 1824, 3pts above the ST model to take into account bid/ask spread)

- NDX: stopped

- CAC: short at 4272.14 (stop @ 4297, 5pts above the ST model to take into account bid/ask spread)

- DAX: stopped

- EStoxx: short at 3027.17 (stop @ 3038, 5pts above the ST model to take into account bid/ask spread)


Medium Term Trading Book:


- No more medium term position at this stage.


Out of model position: (hedge against a blow off rally like in 2000)


- 1 call NDX January 2014 strike 3700 @ 5.06

Partager cet article
Repost0
13 décembre 2013 5 13 /12 /décembre /2013 09:49

When we look at the chart of the Sigma Whole Market Index, we can notice the index slid below its support and (re)entered the (red) uptrend channel. The top of this uptrend should (normally) act as a resistance now.

If we drop until the blue horizontal support, a head and shoulders could be under construction..


usmarket20131212.JPG


Looking at the CAC40, we tested the first horizontal support and the market printed a 'doji' on Thursday. So, a rebound is now possible. If we go through the (first) support, the next target is the 3940's area.


chartcac20131212.JPG


The EuroStoxx 50 went through its first support and the next one is around 2875.


chartestox20131212.JPG


Looking at our indicators, there is no change. The Trend Level(TL) remains at '1' so if we get a positive impulse day, the ST model will generate a buy signal.


stmodel20131212.JPG


The ST model computed new stop levels for both the CAC40 and the EuroStoxx50.


stcac20131212.JPG

stestox20131212.JPG


Short Term Trading Book:


- SPX: short at 1792.26 (stop @ 1827, 3pts above the ST model to take into account bid/ask spread)

- NDX: stopped

- CAC: short at 4272.14 (stop @ 4299, 5pts above the ST model to take into account bid/ask spread)

- DAX: stopped

- EStoxx: short at 3027.17 (stop @ 3040, 5pts above the ST model to take into account bid/ask spread)


Medium Term Trading Book:


- No more medium term position at this stage.


Out of model position: (hedge against a blow off rally like in 2000)


- 1 call NDX January 2014 strike 3700 @ 5.06

Partager cet article
Repost0
12 décembre 2013 4 12 /12 /décembre /2013 07:59

The Sigma Whole Market Index declined on Wednesday and it is now on a strong support (the top of previous uptrend channel). As this channel lasted several months, this is a strong support.

If the market breaks below this level, we should get an acceleration to the downside and next supports are much lower (point 2 & 3 on the chart).


usmarket20131211.JPG


The Eurostoxx50 is breaking its first support. The next one is roughly 2% below current level (at 2875). On the CAC40, the first support is at 4050 (0.8% below Wednesday's close), and the next one is around 3940 (3% below Wednesday's close)


chartestox20131211.JPG

chartcac20131211.JPG


Looking at our indicators, both the Swing and the Power Level Was at '1', telling us Wednesday's decline was impulsive.

The Trend Level is already at '1'. So, if we get an impulsive move to the upside on Thursday, this will generate a buy signal.


stmodel20131211.JPG


There is no change in our trading book.


Short Term Trading Book:


- SPX: short at 1792.26 (stop @ 1827, 3pts above the ST model to take into account bid/ask spread)

- NDX: stopped

- CAC: short at 4272.14 (stop @ 4319, 5pts above the ST model to take into account bid/ask spread)

- DAX: stopped

- EStoxx: short at 3027.17 (stop @ 3055, 5pts above the ST model to take into account bid/ask spread)


Medium Term Trading Book:


- No more medium term position at this stage.


Out of model position:


- 1 call NDX January 2014 strike 3700 @ 5.06

Partager cet article
Repost0
11 décembre 2013 3 11 /12 /décembre /2013 09:02

The Sigma Whole Market Index slightly declined on Tuesday. So, the possible double top we identified on Monday remains valid. We would be surprised that this bull run ends on a 'clean double top' without a crazy asymptotic move, but a consolidation before the 'crazy move' is possible. We could consolidate until next Fed meeting and then rally.


usmarket20131210.JPG


The negative divergence between the Sigma Smart Money Index and the Sigma Whole Market Index remains well in place.


ssmi20131210.JPG


Looking at the CAC40 and the Eurostoxx50, the open gap at 4050 (on the CAC40) and the horizontal support around 2875 (on the Eurostoxx50) are the next obvious target if we break Friday's low.


chartestox20131210.JPG

cac20131210


There is no change in our indicators. The Sigma Trend Index remains in positive territory and other indicators are neutral (at '3').


stmodel20131210.JPG


There is no change in our trading book.


Short Term Trading Book:


- SPX: short at 1792.26 (stop @ 1827, 3pts above the ST model to take into account bid/ask spread)

- NDX: stopped

- CAC: short at 4272.14 (stop @ 4319, 5pts above the ST model to take into account bid/ask spread)

- DAX: stopped

- EStoxx: short at 3027.17 (stop @ 3055, 5pts above the ST model to take into account bid/ask spread)


Medium Term Trading Book:


- No more medium term position at this stage.


Out of model position:


- 1 call NDX January 2014 strike 3700 @ 5.06

Partager cet article
Repost0
10 décembre 2013 2 10 /12 /décembre /2013 08:05

When we look at the chart of the Sigma Whole Market Index, there is a possible double top in formation. Nevertheless, we would be surprised that such a momentum driven market ends on a double top. We believe the blow off top is the more probable scenario.

The NDX continues to rally and its chart is more and more in line with 2000's situation. We believe this index is the best one to play the asymptotic rally. This is the reason why we bought a call on this index.


usmarket20131209.JPG


Looking at our indicators, there is no change: the Sigma Trend Index is in positive territory and all other indicators are neutral (at '3').


stmodel20131209.JPG


There is no change in our trading book.


Short Term Trading Book:


- SPX: short at 1792.26 (stop @ 1827, 3pts above the ST model to take into account bid/ask spread)

- NDX: stopped

- CAC: short at 4272.14 (stop @ 4319, 5pts above the ST model to take into account bid/ask spread)

- DAX: stopped

- EStoxx: short at 3027.17 (stop @ 3055, 5pts above the ST model to take into account bid/ask spread)


Medium Term Trading Book:


- No more medium term position at this stage.


Out of model position:


- 1 call NDX January 2014 strike 3700 @ 5.06

Partager cet article
Repost0
7 décembre 2013 6 07 /12 /décembre /2013 13:26


Following payrolls data, the market gaped at market open and rally for the whole day. (and closed near session's high). This is exactly in line with the "euphoria" scenario which is building up day after day in this market:  5 days for a decline of less than 1.5%, erased in one big up day.

It seems more and more possible that we will get an asymptotic move in order to end this bull run. This is why we bought a call option on the NDX (out of model position).

usmarket20131206.JPG


In Europe the situation is rather different because recent consolidation was a real one: the market lost roughty 5%. Now, we will probably get a rebound but it is difficult to say (at this stage) if it will be a rebound in a downtrend or if the correction is over and we are ready for new highs: both scenario are valid.


chartcac20131206bull.JPG

chartcac20131206bear.JPG


Looking at our indicators, the Sigma Trend Index jumped back in positive territory. Friday's move was impulsive as mentioned by the Swing at '4'.


stmodel20131206.JPG


The ST model computed new stop levels on both the CAC and the Eurostoxx:


stcac20131206.JPG

stestox20131206-copie-2.JPG


Short Term Trading Book:


- SPX: short at 1792.26 (stop @ 1827, 3pts above the ST model to take into account bid/ask spread)

- NDX: stopped

- CAC: short at 4272.14 (stop @ 4319, 5pts above the ST model to take into account bid/ask spread)

- DAX: stopped

- EStoxx: short at 3027.17 (stop @ 3055, 5pts above the ST model to take into account bid/ask spread)


Medium Term Trading Book:


- No more medium term position at this stage.


Out of model position:


- 1 call NDX January 2014 strike 3700 @ 5.06

Partager cet article
Repost0

Presentation

  • : Le blog de sigmatradingoscillator
  • : Professionnel de la finance de marché depuis plus de 10ans, j'ai mis au point une série d'outils de trading me permettant de prendre et couper mes positions. Ici, j'écris un update quotidien sur la situation du CAC,DAX, Eurostoxx, SP500, Nasdaq100. Attention Les éléments repris dans ce blog représentent uniquement mon opinion personnelle et ne constituent en aucun cas une incitation au trading ou du conseil financier. Pour du conseil, consultez votre conseiller en placement
  • Contact

Disclaimer

NO MATERIAL HERE CONSTITUTES "INVESTMENT ADVICE" NOR IS IT A RECOMMENDATION TO BUY OR SELL ANY FINANCIAL INSTRUMENT, INCLUDING BUT NOT LIMITED TO STOCKS, COMMODITIES, OPTIONS, BONDS, FUTURES, OR BULLION. ACTIONS YOU UNDERTAKE AS A CONSEQUENCE OF OUR ANALYSIS, OPINION OR ADVERTISEMENT ON THIS SITE ARE YOUR SOLE RESPONSIBILITY.

FOR INVESTMENT ADVICE, PLAN A MEETING WITH A FINANCIAL ADVISOR IN ORDER TO ESTABLISH YOUR OWN RISK PROFILE.

Archives

Pages