Overblog
Suivre ce blog Administration + Créer mon blog
8 mars 2014 6 08 /03 /mars /2014 07:13

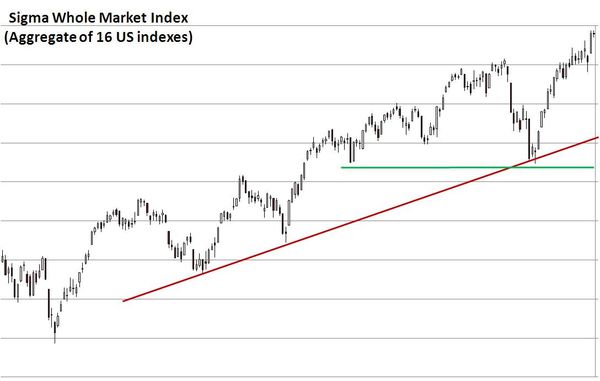
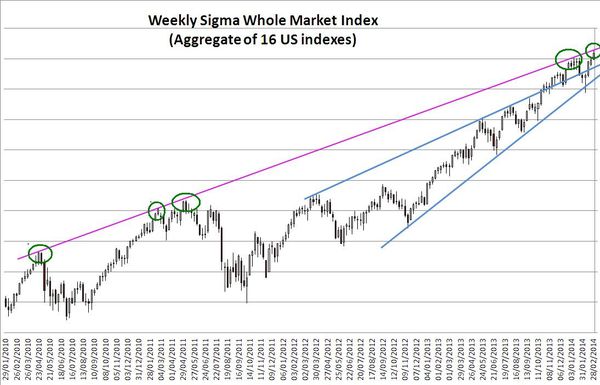
Looking at the weekly chart of the Sigma Whole Market Index, we can notice the market closed for the first time (since early 2010) above its pink ascending resistance. An acceleration at this stage in the cycle is either a false break (bull trap) or a clear breakout leading to an exhaustion move (asymptotic move).


SWMW20140307.JPG


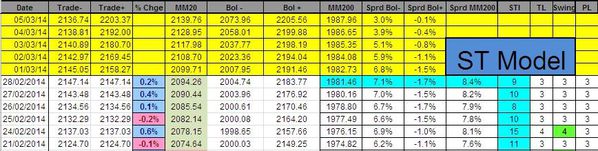
Until Thursday we were close to enter the weekly sell zone but with Friday's weak session, the weekly Sigma Trend Index ended the week at '40' and we are below the key 50 level. ('50' is the required level, on a weekly basis, in order to enter the sell zone). So, we won't be able to get a weekly sell signal next week and the MT model will remain neutral.

(for more detail related to our buy and sell signal, please have a look at our methodology).


MTmodel20140307.JPG


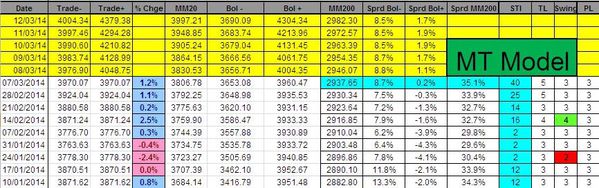
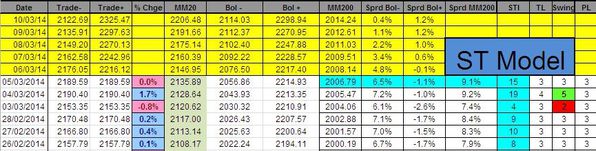
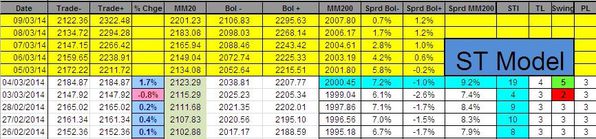
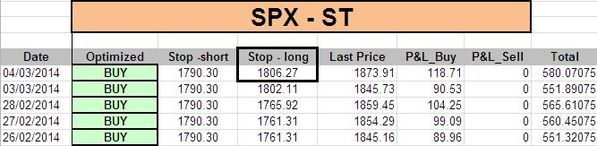
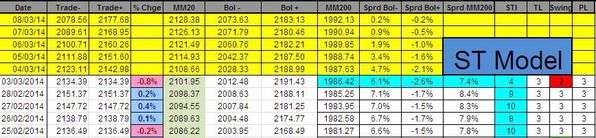
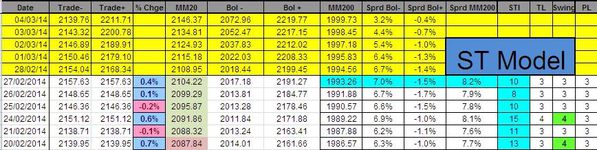
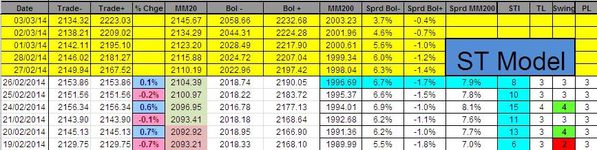
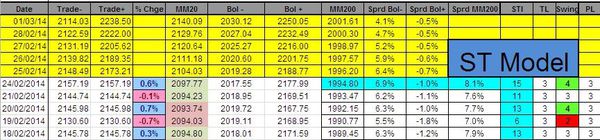
Looking at the Short Term model, there was no new information on Friday. The daily Sigma Trend Index closed at 18, well below the key '34' level required for a sell signal (for more detail related to our buy and sell signal, please have a look at our methodology).


stmodel20140307.JPG


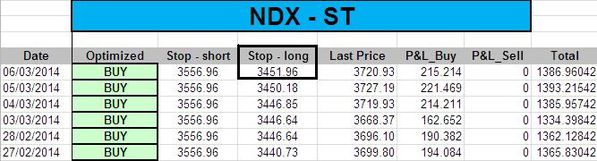
The ST model sharply uplifted its stop on the NDX:


stndx20140307.JPG


Short Term Trading Book:


- SPX: long at 1754.73 (stop @ 1806, 3pts below the ST model to take into account bid/ask spread)

- NDX: long at 3506.23 (stop @ 3583, 5pts below the ST model to take into account bid/ask spread)

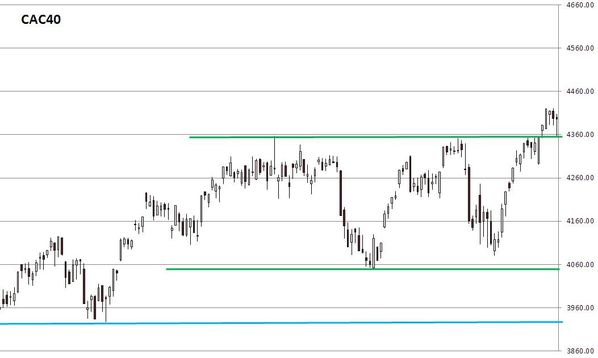
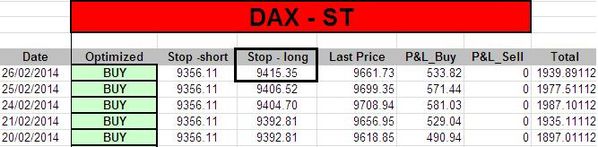
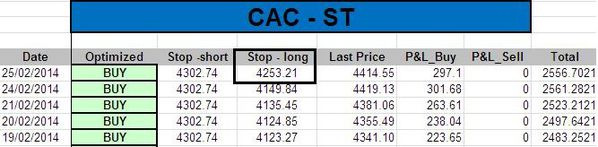
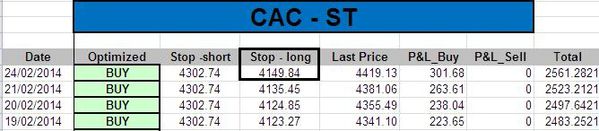
- CAC: long at 4107.69(stop @ 4253, 5pts below the ST model to take into account bid/ask spread) 


Medium Term Trading Book:


- No more medium term position at this stage.


Out of model position: 


- 1 put SPX, MAY, strike 1400 @ usd2.85

Partager cet article
Repost0
7 mars 2014 5 07 /03 /mars /2014 07:52

Everything is in our indicators. The Sigma Trend Index is at '20', very close to the key '34' level. It as always difficult to anticipate the rate of change in our indicators but we think an up move in the range of 1.2%-1.5% should push the Sigma Trend Index above '34'.


stmodel20140306.JPG


The ST model computed new stop levels on all positions:


stspx20140306.JPG

stndx20140306.JPG

stcac20140306.JPG


Short Term Trading Book:


- SPX: long at 1754.73 (stop @ 1806, 3pts below the ST model to take into account bid/ask spread)

- NDX: long at 3506.23 (stop @ 3449, 5pts below the ST model to take into account bid/ask spread)

- CAC: long at 4107.69(stop @ 42538, 5pts below the ST model to take into account bid/ask spread) 


Medium Term Trading Book:


- No more medium term position at this stage.


Out of model position: 


- 1 put SPX, MAY, strike 1400 @ usd2.85

Partager cet article
Repost0
6 mars 2014 4 06 /03 /mars /2014 08:23

Wednesday was a low volatility day. In other words, it was a borring day... There is nothing special to notice on the daily chart of the Sigma Whole Market Index but the weekly chart will (probably) be interesting to analyse during the week-end.


SWM20140405.JPG


Nevertheless, the negative divergence between the Sigma Smart Money Index and the Sigma Whole Market Index is still in place. This is a warning signal for the market.


SSMI20140306.JPG

Looking at our indicators, the Sigma Trend Index eased a little bit to '15' but it remains close to the key '34' level. The end of the week will be very exciting because a surge in the market could push the Sigma Trend Index (daily and weekly)  in 'sell' zone.


STmodel20140305.JPG


The ST model uplifted its stop on the NDX:


stndx20140305.JPG


Short Term Trading Book:


- SPX: long at 1754.73 (stop @ 1803, 3pts below the ST model to take into account bid/ask spread)

- NDX: long at 3506.23 (stop @ 3445, 5pts below the ST model to take into account bid/ask spread)

- CAC: long at 4107.69(stop @ 4248, 5pts below the ST model to take into account bid/ask spread) 


Medium Term Trading Book:


- No more medium term position at this stage.


Out of model position: 


- 1 put SPX, MAY, strike 1400 @ usd2.85

Partager cet article
Repost0
5 mars 2014 3 05 /03 /mars /2014 08:16

The Sigma Whole Market Index surged on Tuesday, reaching a new 52 weeks highs. There is no sign of reversal at this stage.


SWM20140304.JPG


The Sigma Trend Index jumped to '19'. We are not very far from the key '34' level required for a 'sell' signal. The swing was at '5', telling the move was highly impulsive.


stmodel20140304.JPG


The ST model uplifted its stop on the SPX:


stspx20140304.JPG


There is no change in our positions:


Short Term Trading Book:


- SPX: long at 1754.73 (stop @ 1803, 3pts below the ST model to take into account bid/ask spread)

- NDX: long at 3506.23 (stop @ 3442, 5pts below the ST model to take into account bid/ask spread)

- CAC: long at 4107.69(stop @ 4248, 5pts below the ST model to take into account bid/ask spread) 


Medium Term Trading Book:


- No more medium term position at this stage.


Out of model position: 


- 1 put SPX, MAY, strike 1400 @ usd2.85

 - 1 short CAC @ 4398

Partager cet article
Repost0
4 mars 2014 2 04 /03 /mars /2014 08:48

Looking at the chart of the Sigma Whole Market Index, there is no clear bearish sign. The index was able to recover at the end of the day and the losses were very limited.


SWM20140303.JPG


Nevertheless, we can notice a major negative divergence between the Sigma Smart Money Index and the Sigma Whole Market Index (higher high vs lower high). This is a bearish sign because the Sigma Smart Money Index has a good track record in catching turning points in the market.


SSMI20140303.JPG


The Sigma Trend Index continues to decline and it is now close to its zero line (at '4'). It will be important to monitor if it remains above it or if it slides in negative territory. The swing was at '2', telling us the  move was slightly impulsive.


stmodel20140303.JPG


Some of our positions were stopped on Monday because their stop levels were hit by the market. We booked some nice gains on these positions:

- IBEX stopped @ 9918.32 => 9918.32 - 9745.8 = 172.52 (gains) (well below our stop but due to a gap down)

- DAX stopped @ 9404.67 => 9404.67 - 9106.25 = 298.42 (gains)

- EStox stopped @ 3093.46 => 3093.46 - 2947.84 = 145.62 (gains)


The ST model uplifted its stop on the SPX:


stspx20140303.JPG


Short Term Trading Book:


- SPX: long at 1754.73 (stop @ 1799, 3pts below the ST model to take into account bid/ask spread)

- NDX: long at 3506.23 (stop @ 3442, 5pts below the ST model to take into account bid/ask spread)

- CAC: long at 4107.69(stop @ 4248, 5pts below the ST model to take into account bid/ask spread) 


Medium Term Trading Book:


- No more medium term position at this stage.


Out of model position: 


- 1 put SPX, MAY, strike 1400 @ usd2.85

 - 1 short CAC @ 4398

Partager cet article
Repost0
2 mars 2014 7 02 /03 /mars /2014 21:34


The Sigma Whole Market Index reached its medium term resistance (pink line) on Friday. It will be very interesting to monitor if the market can move above this line in coming days. This resistance stopped 4 rallies in the past.


SWMW20140228.JPG


(On a daily basis) The market printed a perfect doji on Friday. This pattern could signal the beginning of a short term consolidation.


SWM20140228.JPG


There is no new information in our indicators. The Sigma Trend Index is well below the key '34' level (at '9'). So, it won't be possible to get a sell signal in coming days.


stmodel20140228.JPG


The ST model computed new stops on the NDX and the SPX:


stndx20140228.JPG

stspx20140228.JPG


Short Term Trading Book:


- SPX: long at 1754.73 (stop @ 1763, 3pts below the ST model to take into account bid/ask spread)

- NDX: long at 3506.23 (stop @ 3442, 5pts below the ST model to take into account bid/ask spread)

- CAC: long at 4107.69(stop @ 4248, 5pts below the ST model to take into account bid/ask spread) 

- EStoxx: long at 2947.84 (stop @ 3094, 5pts below the ST model to take into account bid/ask spread)

- DAX: long at 9106.25 (stop @ 9405, 10pts below the ST model to take into account bid/ask spread)

- IBEX: long at 9745.8 (stop @ 9970, 10pts below the ST model to take into account bid/ask spread)


Medium Term Trading Book:


- No more medium term position at this stage.


Out of model position: 


- 1 put SPX, MAY, strike 1400 @ usd2.85

 - 1 short CAC @ 4398

Partager cet article
Repost0
28 février 2014 5 28 /02 /février /2014 08:14

After trading well under water at night (on the future market), US equities opened slightly lower. After some sideways action, the market resumed its uptrend and closed higher for the day. Today's price action is bullish (short term).


SWM20140227b.JPG


In Europe, the CAC is very interesting. After a sharp decline early in the session, printing a false break relative to previous high (by a couple of points), the CAC sharply bounced back at the end of the session and closed nearly flat. Looking at this candle, this also looks short term bullish.


chartcac20140227.JPG


There is no new information coming from our indicators.


stmodel20140227.JPG


The ST model uplifted its stop on the IBEX:


stibex20140227.JPG


Short Term Trading Book:


- SPX: long at 1754.73 (stop @ 1758, 3pts below the ST model to take into account bid/ask spread)

- NDX: long at 3506.23 (stop @ 3435, 5pts below the ST model to take into account bid/ask spread)

- CAC: long at 4107.69(stop @ 4248, 5pts below the ST model to take into account bid/ask spread) 

- EStoxx: long at 2947.84 (stop @ 3094, 5pts below the ST model to take into account bid/ask spread)

- DAX: long at 9106.25 (stop @ 9405, 10pts below the ST model to take into account bid/ask spread)

- IBEX: long at 9745.8 (stop @ 9970, 10pts below the ST model to take into account bid/ask spread)


Medium Term Trading Book:


- No more medium term position at this stage.


Out of model position: 


- 1 put SPX, MAY, strike 1400 @ usd2.85

Partager cet article
Repost0
27 février 2014 4 27 /02 /février /2014 08:04

Looking at the chart of the Sigma Whole Market Index, we can notice the market is in consolidation mode above the blue horizontal support. If we can hold this level for a couple of sessions, the market should be able to resume its uptrend. If we drop below this support, it will be short term negative for the market.


SWM20140227.JPG


There is no new information coming from our indicators. The Sigma Trend Index slightly declined to '8', other indicators are neutral at '3'.


stmodel20140226.JPG


The ST model uplifted its stops on some indexes:


stdax20140226.JPG

stibex20140226.JPG


Short Term Trading Book:


- SPX: long at 1754.73 (stop @ 1758, 3pts below the ST model to take into account bid/ask spread)

- NDX: long at 3506.23 (stop @ 3435, 5pts below the ST model to take into account bid/ask spread)

- CAC: long at 4107.69(stop @ 4248, 5pts below the ST model to take into account bid/ask spread) 

- EStoxx: long at 2947.84 (stop @ 3094, 5pts below the ST model to take into account bid/ask spread)

- DAX: long at 9106.25 (stop @ 9405, 10pts below the ST model to take into account bid/ask spread)

- IBEX: long at 9745.8 (stop @ 9928, 10pts below the ST model to take into account bid/ask spread)


Medium Term Trading Book:


- No more medium term position at this stage.


Out of model position: 


- 1 put SPX, MAY, strike 1400 @ usd2.85

Partager cet article
Repost0
26 février 2014 3 26 /02 /février /2014 08:39

The Sigma Whole Market Index printed an inside day on Tuesday (higher low and lower high vs Monday). This tells us the market is looking for its next move.

The market closed, for the second consecutive session, right below the blue resistance.


SWM20140225.JPG


Looking at our indicators, there is no new information for the day. With a Sigma Trend Index at '10' (STI), there is no possibility to get a sell signal in coming sessions.


stmodel20140225.JPG


The ST model computed new stop levels on some indexes. In the case of the CAC, the model sharply uplifted its stop (by more than 100pts):


stcac20140225-copie-1.JPG

stdax20140225.JPG

stibex20140225.JPG


Short Term Trading Book:


- SPX: long at 1754.73 (stop @ 1758, 3pts below the ST model to take into account bid/ask spread)

- NDX: long at 3506.23 (stop @ 3435, 5pts below the ST model to take into account bid/ask spread)

- CAC: long at 4107.69(stop @ 4248, 5pts below the ST model to take into account bid/ask spread) 

- EStoxx: long at 2947.84 (stop @ 3094, 5pts below the ST model to take into account bid/ask spread)

- DAX: long at 9106.25 (stop @ 9396, 10pts below the ST model to take into account bid/ask spread)

- IBEX: long at 9745.8 (stop @ 9906, 10pts below the ST model to take into account bid/ask spread)


Medium Term Trading Book:


- No more medium term position at this stage.


Out of model position: 


- 1 put SPX, MAY, strike 1400 @ usd2.85

- 2 short CAC @ 4418

Partager cet article
Repost0
25 février 2014 2 25 /02 /février /2014 07:20

We can notice on the chart of the Sigma Whole Market Index that the market moved above its (previous) 52 weeks high on an intraday basis but it was unable to hold on its gains. Finally,  after a sharp decline in the last hour, the market closed just below the previous 52weeks high. This is not really bullish.


SWM20140224.JPG

Another warning signal is coming from the relative performance between bonds and equities: in a normal rally mode (for equities), we should notice a strong outperformance of equities relative to bonds (= risk on). But during recent rally, we can notice a really soft outperformance of equities realtive to bonds. We are well below december's top. This is not a good signal for equities.


bdsvseq20140224.JPG

We reach the same conclusion looking at recent performance of US cyclicals relative to US non cyclicals: we are not in a risk on mode.

For those reasons, I decided to take a side bet (short position) on the CAC40 (at 4418).


cyclvsdef20140224.JPG


Looking at our indicators, the Swing is at '4', telling us the market was impulsive. The Sigma Trend Index is at '15' and there is no possibility to get a sell signal in coming days (too far from the key '34').


stmodel20140224.JPG


The ST model computed new stop levels on all positions:


stspx20140224.JPG

stndx20140224.JPG

stcac20140224.JPG

stdax20140224.JPG

stibex20140224.JPG


Short Term Trading Book:


- SPX: long at 1754.73 (stop @ 1758, 3pts below the ST model to take into account bid/ask spread)

- NDX: long at 3506.23 (stop @ 3435, 5pts below the ST model to take into account bid/ask spread)

- CAC: long at 4107.69(stop @ 4145, 5pts below the ST model to take into account bid/ask spread) 

- EStoxx: long at 2947.84 (stop @ 3094, 5pts below the ST model to take into account bid/ask spread)

- DAX: long at 9106.25 (stop @ 9395, 10pts below the ST model to take into account bid/ask spread)

- IBEX: long at 9745.8 (stop @ 9865, 10pts below the ST model to take into account bid/ask spread)


Medium Term Trading Book:


- No more medium term position at this stage.


Out of model position: 


- 1 put SPX, MAY, strike 1400 @ usd2.85

- short 2 CAC @ 4418

Partager cet article
Repost0

Presentation

  • : Le blog de sigmatradingoscillator
  • : Professionnel de la finance de marché depuis plus de 10ans, j'ai mis au point une série d'outils de trading me permettant de prendre et couper mes positions. Ici, j'écris un update quotidien sur la situation du CAC,DAX, Eurostoxx, SP500, Nasdaq100. Attention Les éléments repris dans ce blog représentent uniquement mon opinion personnelle et ne constituent en aucun cas une incitation au trading ou du conseil financier. Pour du conseil, consultez votre conseiller en placement
  • Contact

Disclaimer

NO MATERIAL HERE CONSTITUTES "INVESTMENT ADVICE" NOR IS IT A RECOMMENDATION TO BUY OR SELL ANY FINANCIAL INSTRUMENT, INCLUDING BUT NOT LIMITED TO STOCKS, COMMODITIES, OPTIONS, BONDS, FUTURES, OR BULLION. ACTIONS YOU UNDERTAKE AS A CONSEQUENCE OF OUR ANALYSIS, OPINION OR ADVERTISEMENT ON THIS SITE ARE YOUR SOLE RESPONSIBILITY.

FOR INVESTMENT ADVICE, PLAN A MEETING WITH A FINANCIAL ADVISOR IN ORDER TO ESTABLISH YOUR OWN RISK PROFILE.

Archives

Pages