The market moved sharply higher on Friday following (bad) payrolls data. It seems stupid to get such a powerful rally on poor numbers but we don't believe the numbers were the main trigger for this rally. The real reason behind this rally is the extreme oversold conditions in which the market was early next week. And the good news is that our ST model was, once again, able to detect this situation and to catch the move.
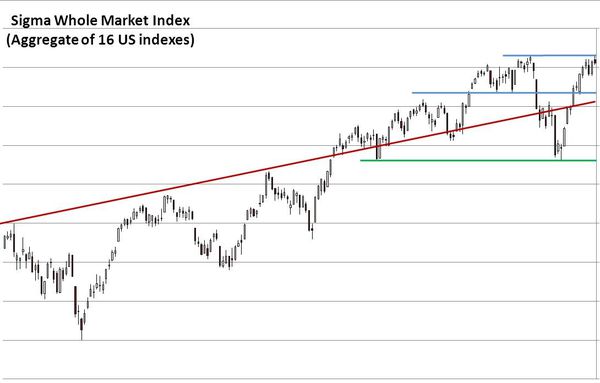
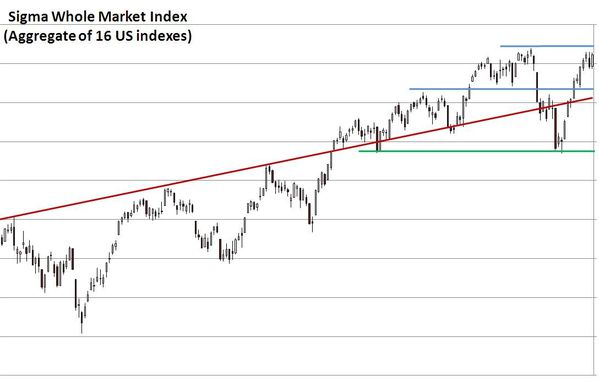
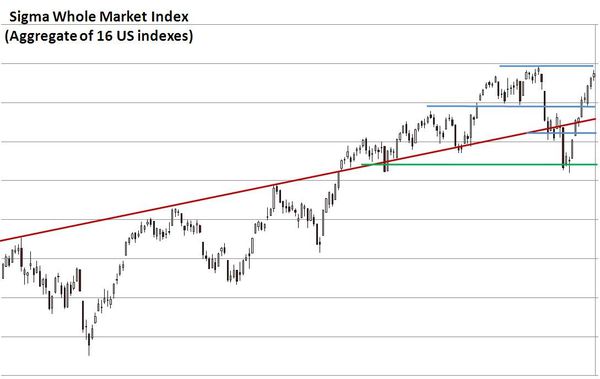
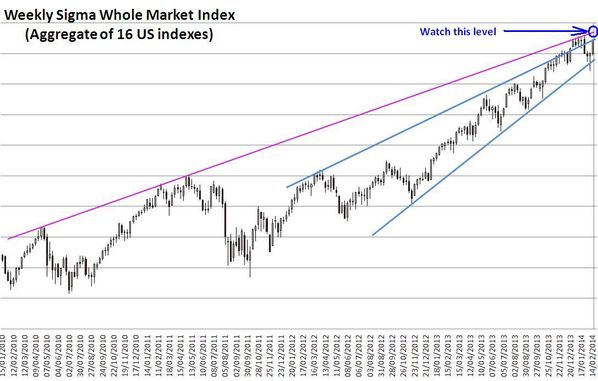
Looking at the Sigma Whole Market Index, we can notice a second consecutive big white candle on Friday. This tells us that current rebound is highly impulsive. It could be a counter trend move but it is so powerful that we give a very low probability to this possibility (but this remains possible).
We don't see any immediate resistance at this level but as the market retraced roughly 61.8% of recent decline, we could have some kind of consolidation early next week (2 to 3 sessions) before resuming the uptrend if the trend is up. If recent jump was just a bounce back in a declining market, we should get a nasty decline by the end of next week.
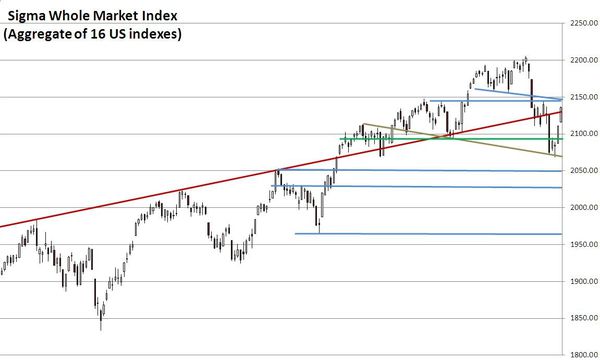
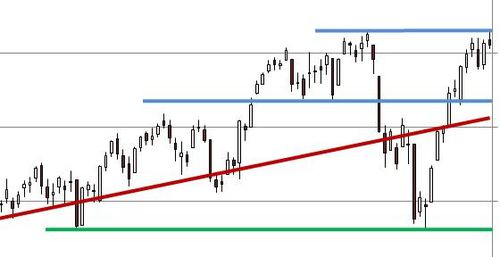
Looking at the Sigma Whole Market Index on a weekly basis, we can identify a clear warning signal we got during the week: the market broke down the rising wedge but was able to close the week inside the wedge. This is something to monitor in coming weeks because a close below the lower ascending blue line would be bearish.
But as long as we trade inside the wedge, there is a possibility to finish current bull market by a final touch of the pink line.

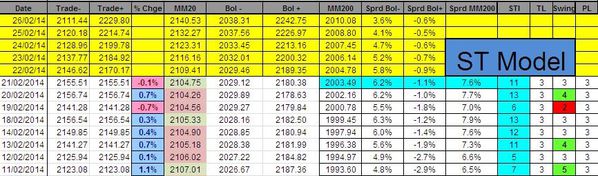
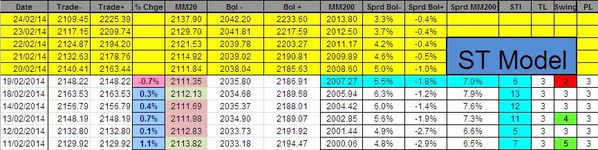
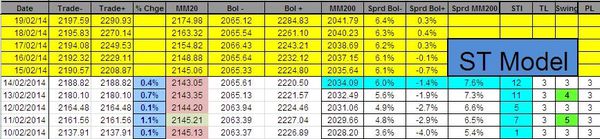
Looking at our indicators, the Swing is at '5', telling us the move was highly impulsive (on Friday) and confirming our chart analysis. The Sigma Trend Index is at '-1' (close to its zero line). So, according to our ST model, this rebound could still be a bounce back in a downtrend (because the STI is not in positive territory yet).

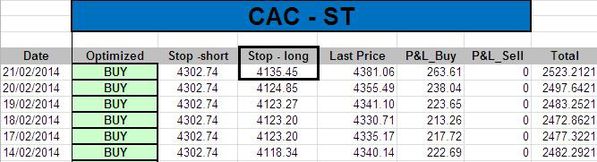
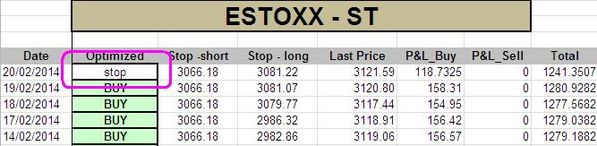
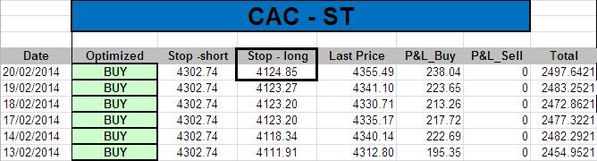
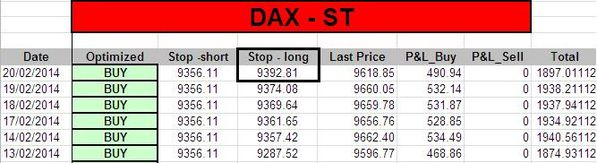
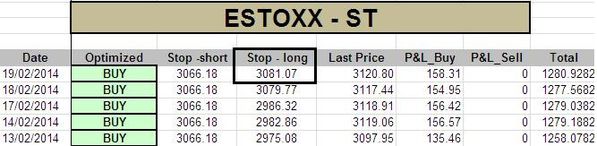
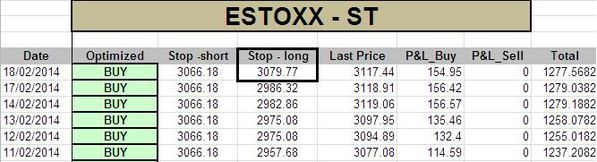
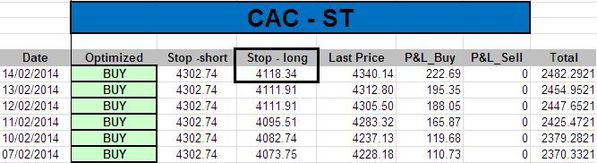
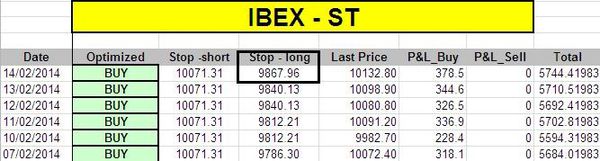
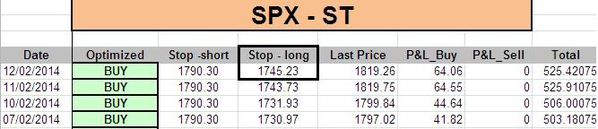
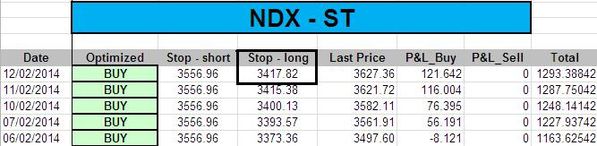
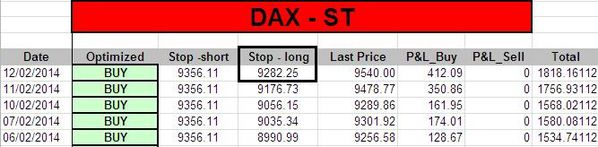
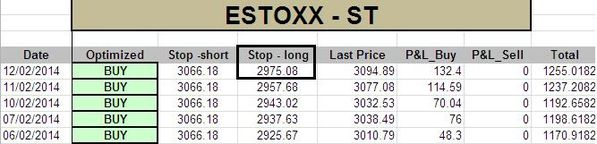
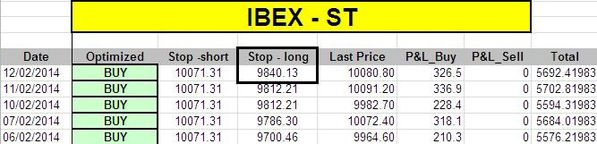
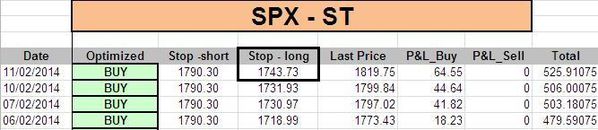
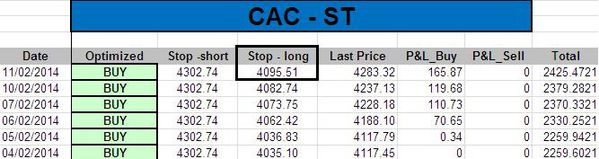
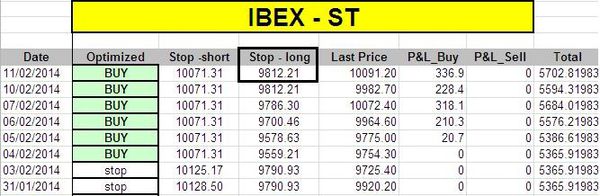
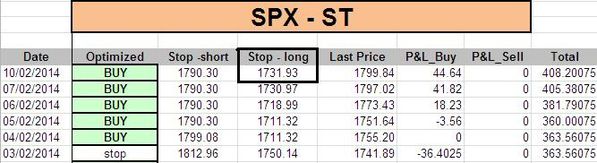
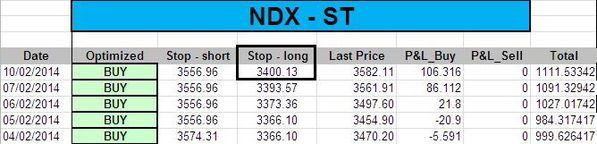
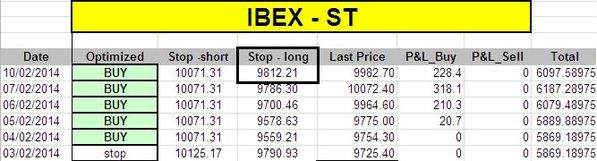
Following this powerful move, the ST model computed new stop levels on all our positions and we uplifted our stops:


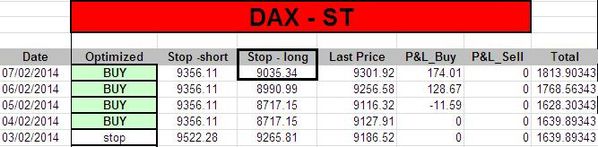


Short Term Trading Book:
- SPX: long at 1754.73 (stop @ 1728, 3pts below the ST model to take into account bid/ask spread)
- NDX: long at 3506.23 (stop @ 3389, 5pts below the ST model to take into account bid/ask spread)
- CAC: long at 4107.69(stop @ 4069, 5pts below the ST model to take into account bid/ask spread)
- EStoxx: long at 2947.84 (stop @ 2933, 5pts below the ST model to take into account bid/ask spread)
- DAX: long at 9106.25 (stop @ 9025, 10pts below the ST model to take into account bid/ask spread)
- IBEX: long at 9745.8 (stop @ 9776, 10pts below the ST model to take into account bid/ask spread)
Medium Term Trading Book:
- No more medium term position at this stage.
Out of model position:
- no position at this stage