1 octobre 2014
3
01
/10
/octobre
/2014
08:57
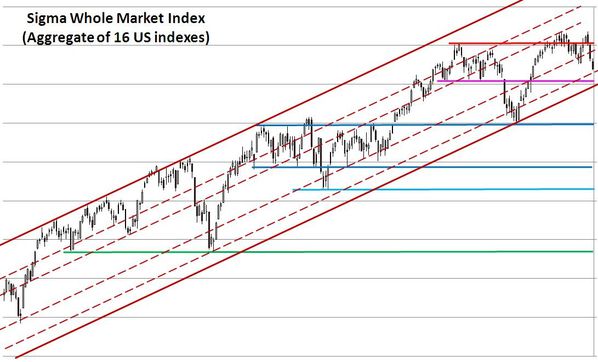
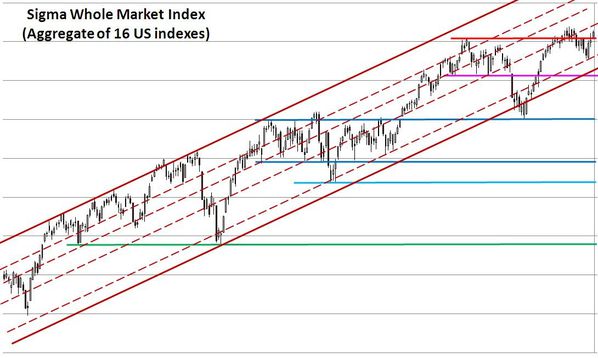
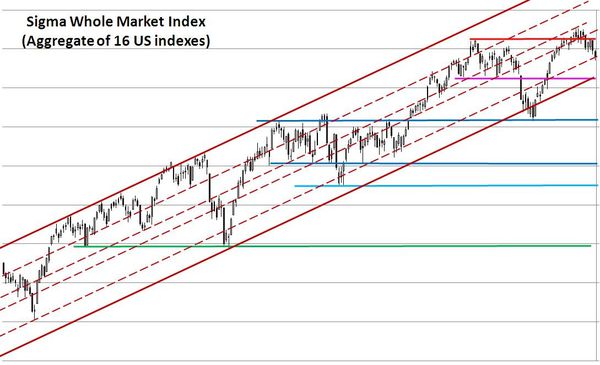
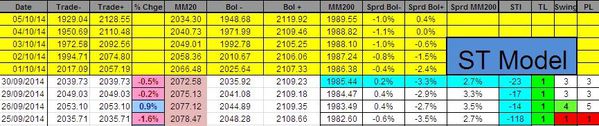
So far so good, the Sigma Whole MArket Index remains above its horizontal support.

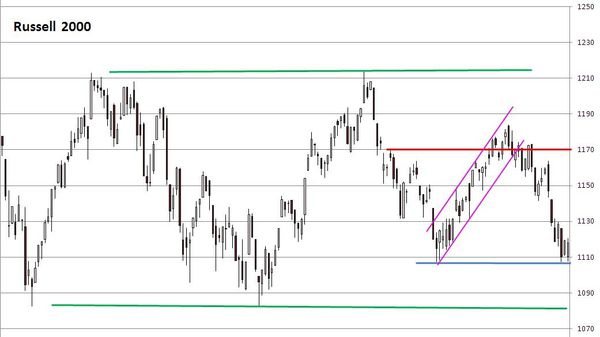
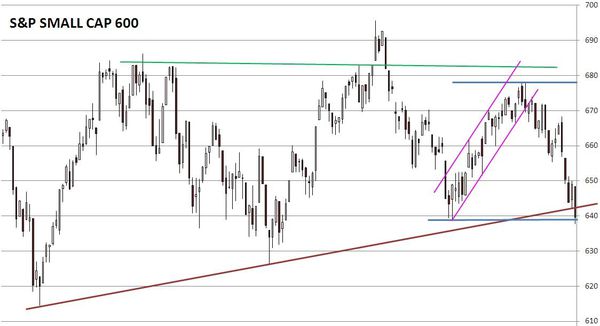
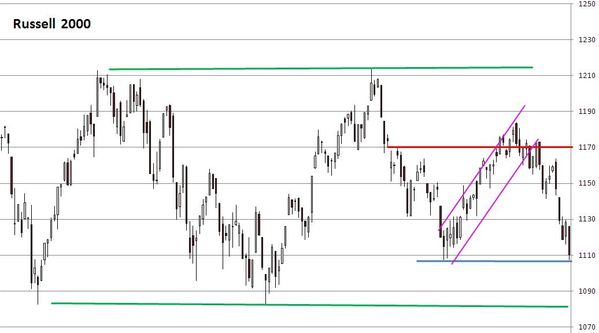
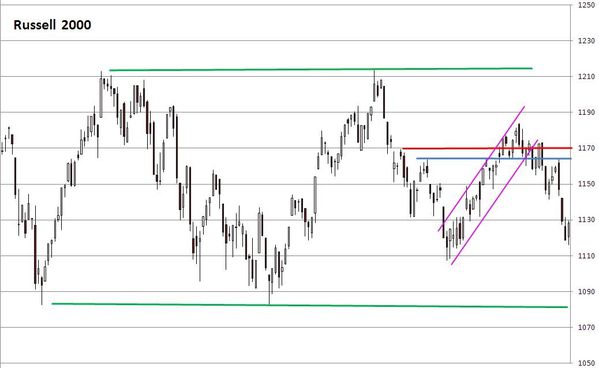
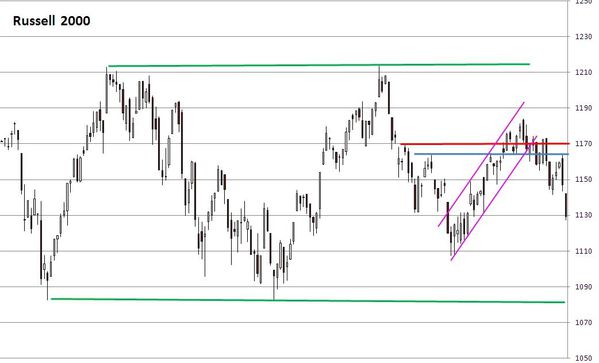
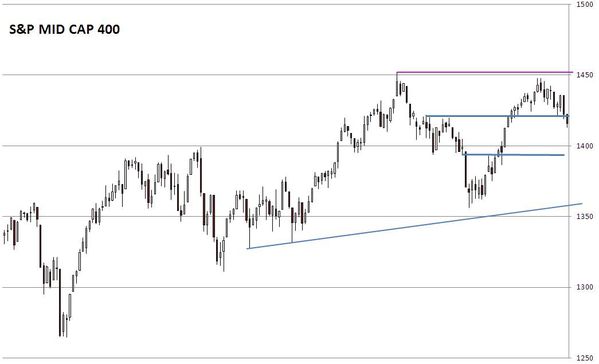
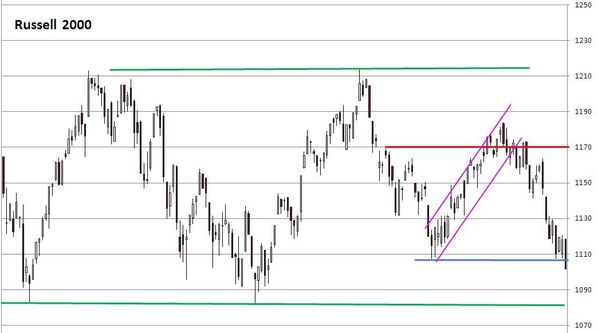
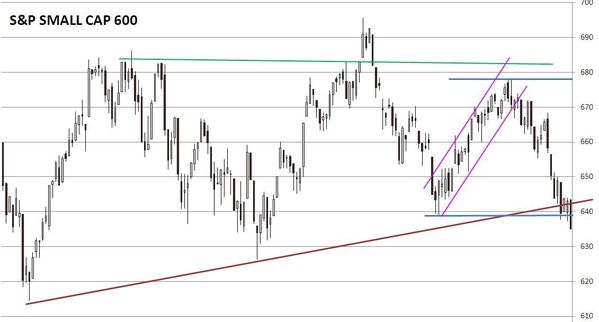
Nevertheless, both the Russell 2000 and the Small Cap 600 declined below their horizontal support. As both index have been leading the market in recent decline, this is a very bad signal for the equity market.
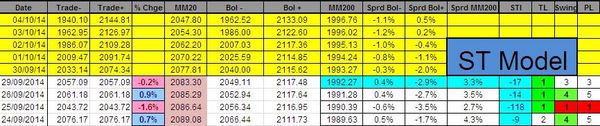
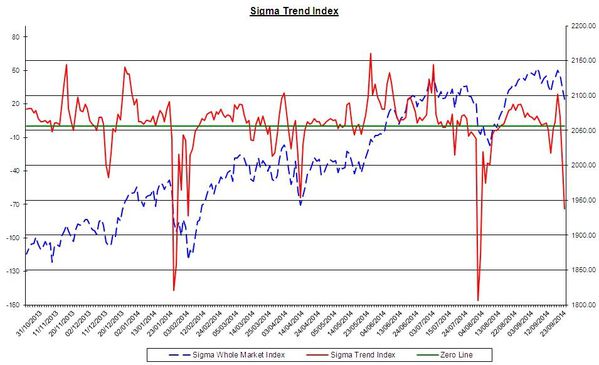
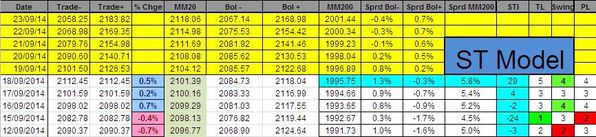
The Sigma Trend Index remains well in negative territory. Both the Swing and the Power Level are neutral.
Short Term Trading Book:
- SPX: long at 1936.12 (stop @ 1926, 3pts below the ST model to take into account bid/ask spread)
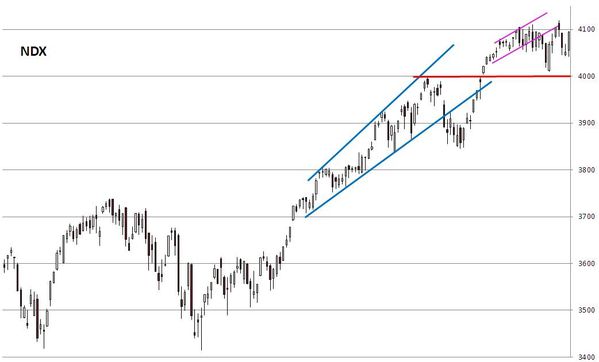
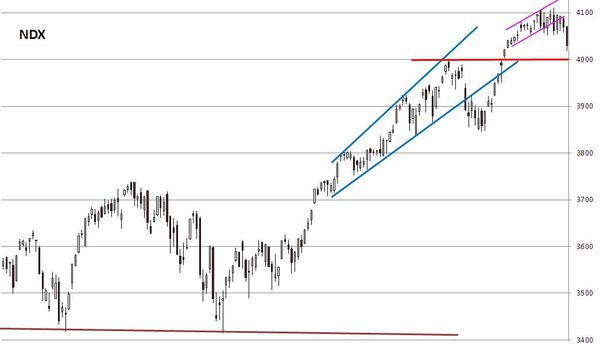
- NDX: long at 3894.96 (stop @ 3999, 5pts below the ST model to take into account bid/ask spread)
- CAC: stopped
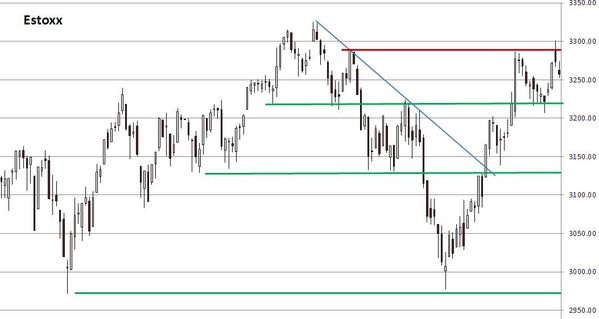
- EStox: stopped
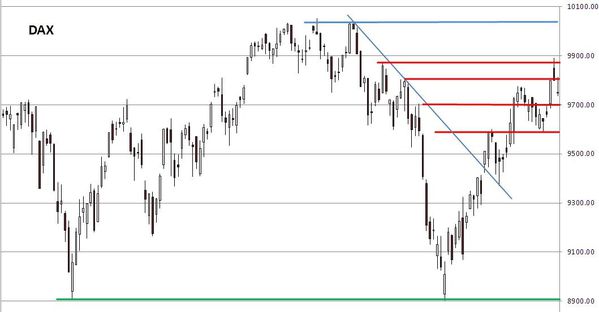
- DAX: stopped
- IBEX: stopped
Partager cet article