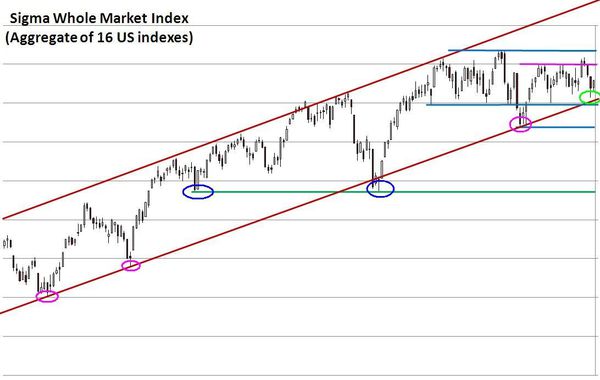
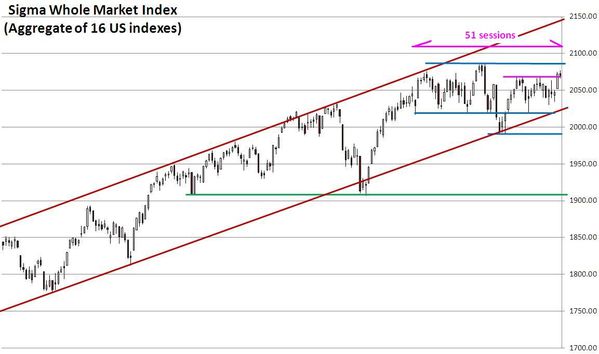
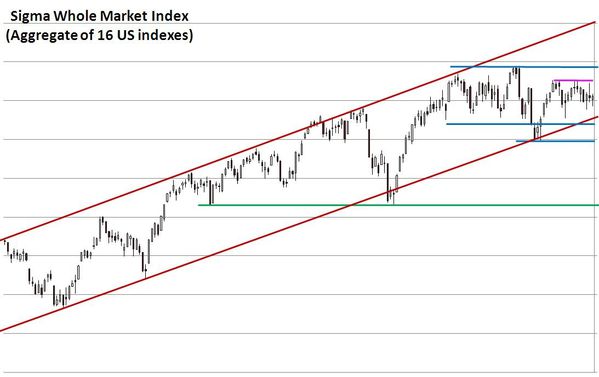
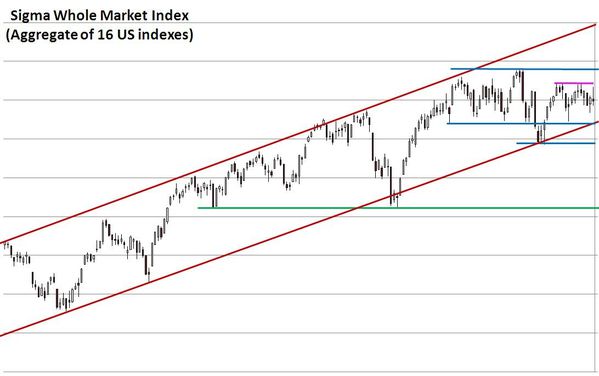
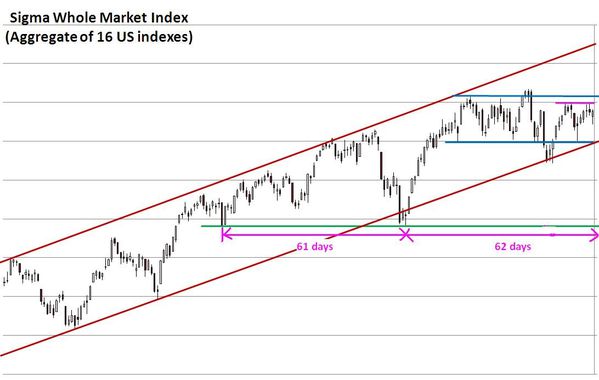
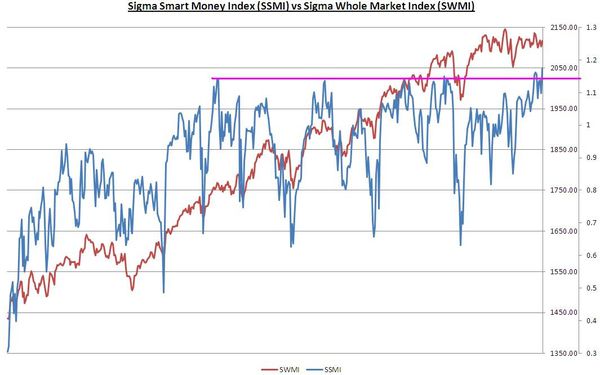
Looking at the Sigma Whole Market Index, we remain stuck in the middle of the trading range. When I biult this index, I didn't imagine it would be so efficient in distribution time.

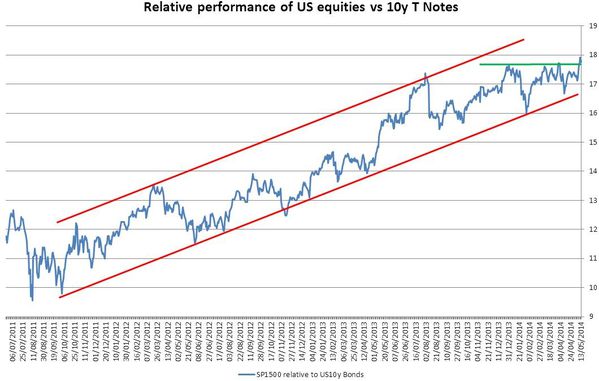
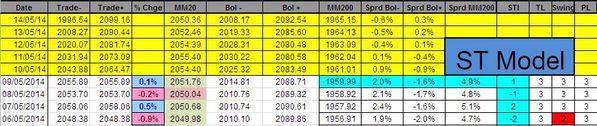
Looking at the Sigma Smart Money Index, we can notice this index was able to move above previous high. We consider this is short term positive for the equity market.
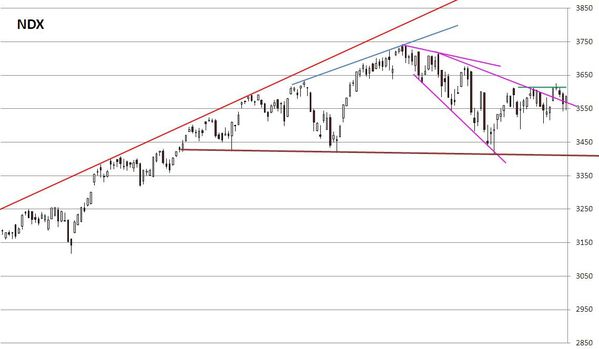
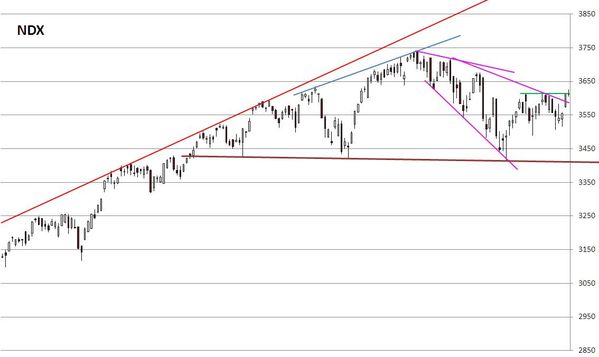
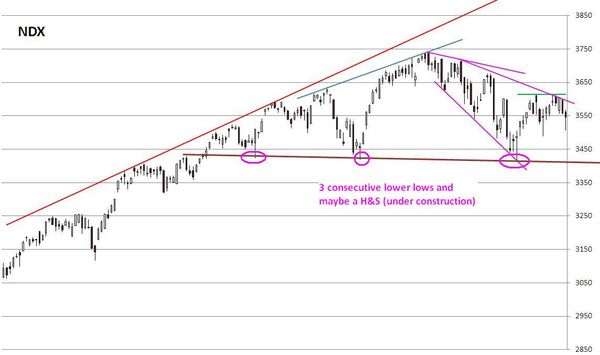
The Nasdaq 100 was also able to move above short term resistance (green horizontal line). This looks rather positive on a short term basis (even if a false break is always possible).

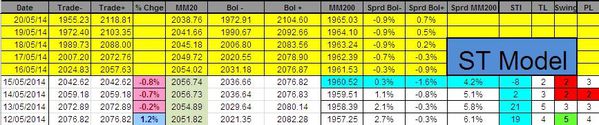
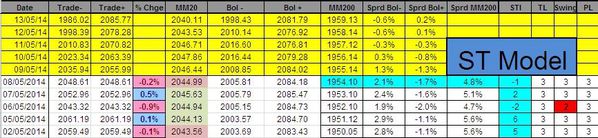
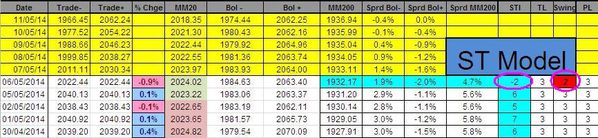
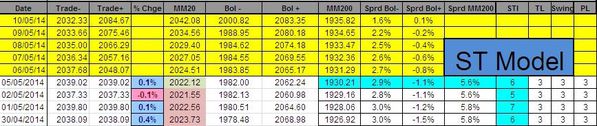
Looking at our indicators, the Swing was at '4', telling us the move was impulsive. The Sigma Trend Index is back in positive territory.

There is no change in our positions.
Short Term Trading Book:
- SPX: long at 1830.28 (stop @ 1816, 3pts below the ST model to take into account bid/ask spread)
- NDX: long at 3477.72(stop @ 3410, 5pts below the ST model to take into account bid/ask spread)
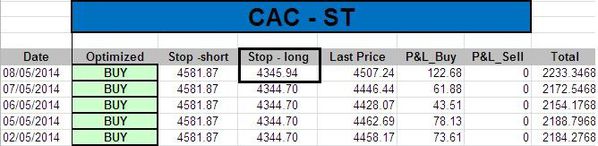
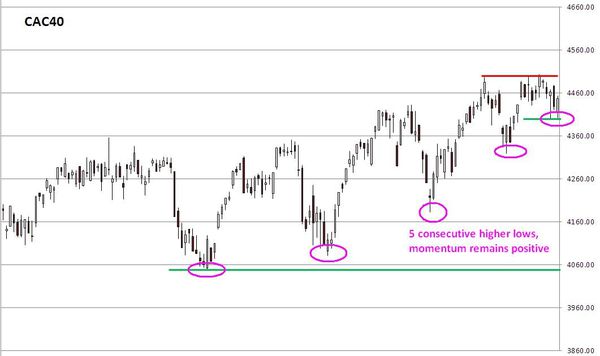
- CAC: long at 4374.06(stop @ 4343, 5pts below the ST model to take into account bid/ask spread)
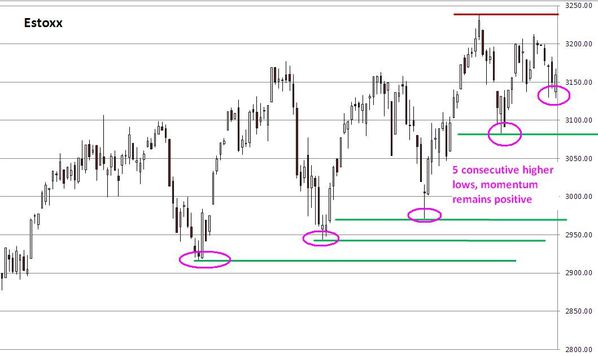
- EStoxx: long at 3115.67 (stop @ 3103, 5pts below the ST model to take into account bid/ask spread)
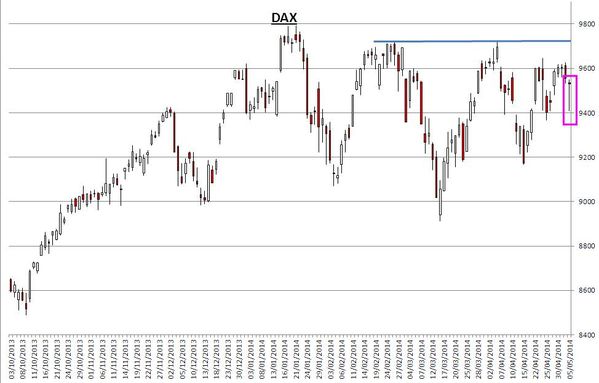
- DAX: stopped
- IBEX: stopped
Medium Term Trading Book:
- No more medium term position at this stage.
Out of model position:
- 2 short NDX @ 3487.38