24 avril 2013
3
24
/04
/avril
/2013
07:44
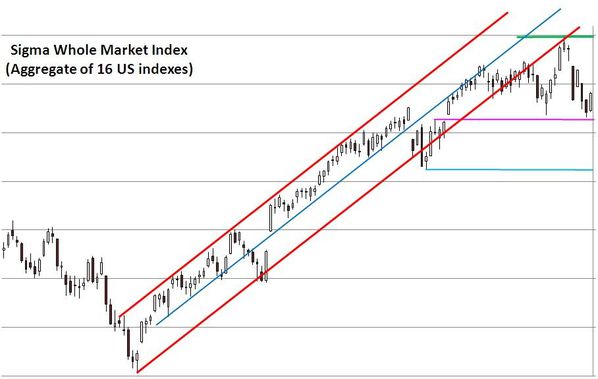
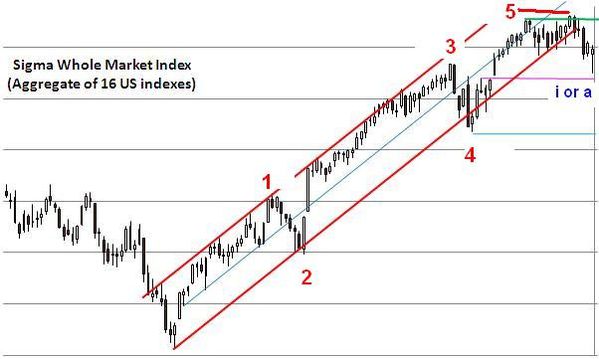
The rebound or new upleg (to be determined) continued. We are now below a major horizontal resistance. If we were in presence of a bounce back, it was a strong one, and the market has to reverse now. If the market is able to close above the green line, new highs will probably be printed on the short term.
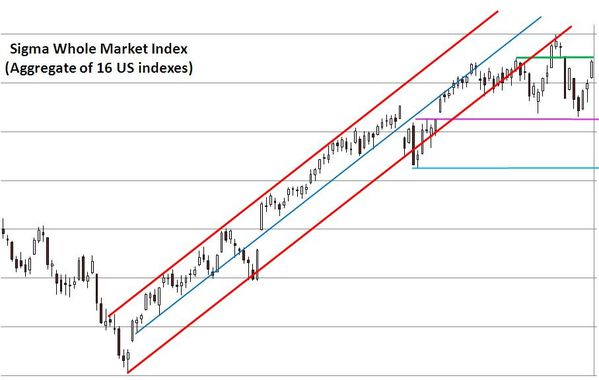
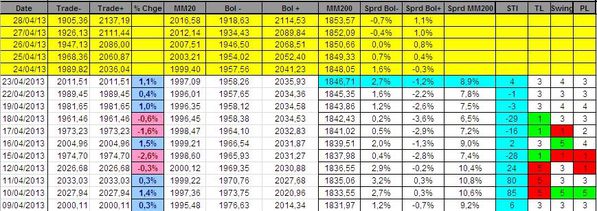
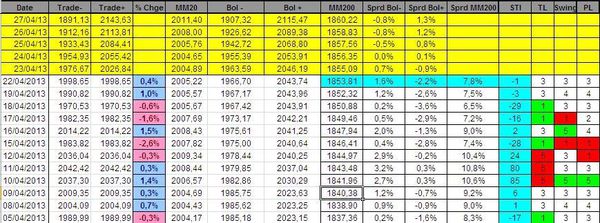
The Sigma trend Index was able to close in positive territory. The swing was at '4', telling us that Tuesday's move was powerful and broad based.
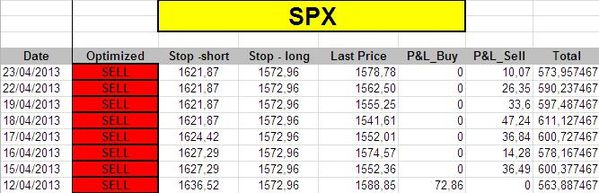
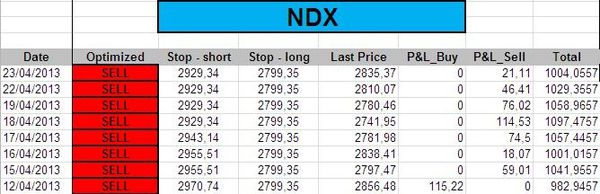
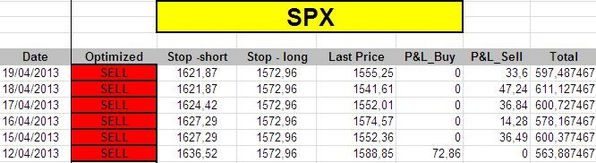
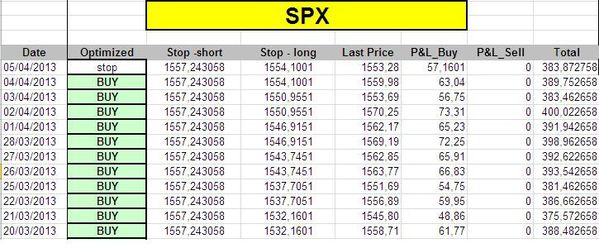
Our short term model remains in 'sell' mode at this stage (stop losses are well above current levels):
conclusion:
Market is at crossroads, and we will know (soon) which way is the right one.
Short term positions:
- short 1/2 SPX at 1560.15
- Short 1/2 NDX at 2805.45
- short 1/2 CAC40 at 3754.88
Medium term positions:
- short 3 SPX at 1446.09
- Short 1 NDX at 2758.8
- short 2 CAC at 3251.07
Published by sigmatradingoscillator
-
dans
Market Analysis
23 avril 2013
2
23
/04
/avril
/2013
07:17
The market continues its rebound after last week decline. If it is nothing else than a rebound, then the weakness should resume before the end of this week. If market can stabilize above the pink horizontal line, then a new upleg is probably on the agenda.

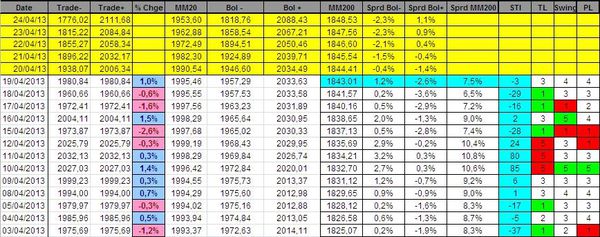
The Sigma Trend Index(STI) is close to its zero line. It will be important to see if it can move in positive territory.
Other indicators are netral at this stage (at '3').
There is no change on our short term model at this stage. Both the NDX and the SPX remain in sell mode:


Conclusion:
The market is in a trading range (between green and pink horizontal lines) and it is difficult to predict which exit will be the right one.
Our short term model gave us a sell signal on the 22nd of April, and it remains valid at this stage.
Short term positions:
- short 1/2 SPX at 1560.15
- Short 1/2 NDX at 2805.45
- short 1/2 CAC40 at 3754.88
Medium term positions:
- short 3 SPX at 1446.09
- Short 1 NDX at 2758.8
- short 2 CAC at 3251.07
Published by sigmatradingoscillator
-
dans
Market Analysis
21 avril 2013
7
21
/04
/avril
/2013
09:30
The market succesfully tested the pink horizontal support. The key question now is: Is it the start of a new upleg or is it just a dead cat bond?
Looking at the chart; it is difficult to have a clear answer to this question.
Our indicators don't give us any new information. So, our short term model remains in sell mode:
Updated stop loss for the SPX and the NDX are:

Conclusion:
As long as the pink horizontal support holds on, a new upleg remains possible.
Our short term model remains in sell mode at this stage.
Short term positions:
- short 1/2 SPX at 1560.15
- Short 1/2 NDX at 2805.45
- short 1/2 CAC40 at 3754.88
Medium term positions:
- short 3 SPX at 1446.09
- Short 1 NDX at 2758.8
- short 2 CAC at 3251.07
Published by sigmatradingoscillator
-
dans
Market Analysis
18 avril 2013
4
18
/04
/avril
/2013
08:14
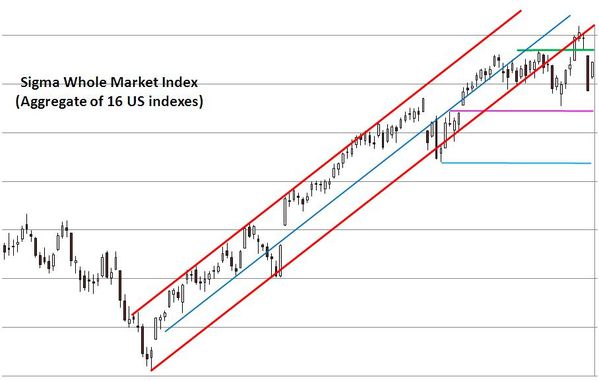
The market printed a lower low on Wednesday, but remains above early April low. If the market is able to go through the pink support, we believe it could quickly drop until the blue horizontal support.

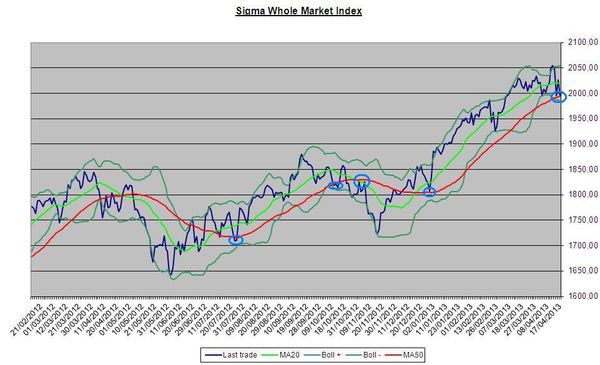
If we take a longer time horizon, we can notice that the Sigma Whole Market Index is now on its 50 days MA (red line on the chart below). In the past, this MA acted as a powerful support to the market.
Looking at our indicators, the Swing moved again to '1', and the Sigma Trend Index moved back in negative territory:

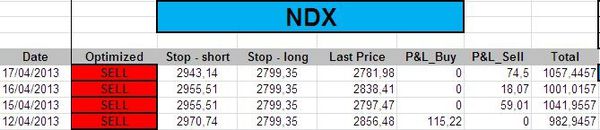
Our short term model remains in sell mode for both the SPX and the NDX:

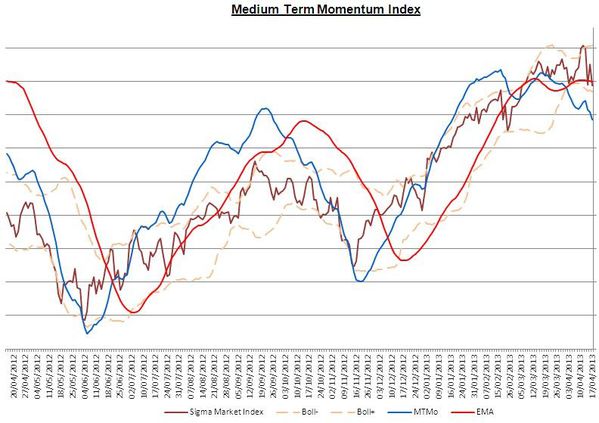
Our medium term momentum index remains in sell mode (blue line below the red line):
Conclusion:
Both our short term and our medium term models are in sell mode. Nevertheless, the market is now on strong supports, and it won't be easy to move below those levels.
Short term positions:
- short 1/2 SPX at 1560.15
- Short 1/2 NDX at 2805.45
- short 1/2 CAC40 at 3754.88
Medium term positions:
- short 3 SPX at 1446.09
- Short 1 NDX at 2758.8
- short 2 CAC at 3251.07
Published by sigmatradingoscillator
-
dans
Market Analysis
17 avril 2013
3
17
/04
/avril
/2013
07:43
The market rebounded on Tuesday. Sure we got a white candle but when we compare the size of this white candle with the size of the black one we got on Monday, we can't say that Tuesday's session was impressive. It looks like a rebound/consolidation after a sharp decline.
Looking at our indicators, the Swing moved 'close' to '5' but didn't reach it. (We have a '5' in the table due to round fonction but the swing was below '5'). So, our short term model didn't generate a 'buy' signal, and remain in 'sell'.

So, our short term model remains in 'sell' for both the SPX and the NDX:


Conclusion:
Tuesday's rebound looks like a consolidation after the sharp decline we got on Monday rather than the start of a new upleg. There is no change in our view at this stage.
Short term positions:
- short 1/2 SPX at 1560.15
- Short 1/2 NDX at 2805.45
- short 1/2 CAC40 at 3754.88
Medium term positions:
- short 3 SPX at 1446.09
- Short 1 NDX at 2758.8
- short 2 CAC at 3251.07
Published by sigmatradingoscillator
-
dans
Market Analysis
16 avril 2013
2
16
/04
/avril
/2013
09:18
Looking at the chart, there is not doubt that Monday's decline was impulsive: big black candle. This move sounds like a powerful reversal and seems to confirm the sell signal we got on Friday (by ou short term model).

The Sigma trend Index(STI) declined sharply on Monday (from 24 to -28). It is interesting to notice that the TL is already at '1' and that both the Swing and the power level (PL) are at '1'.
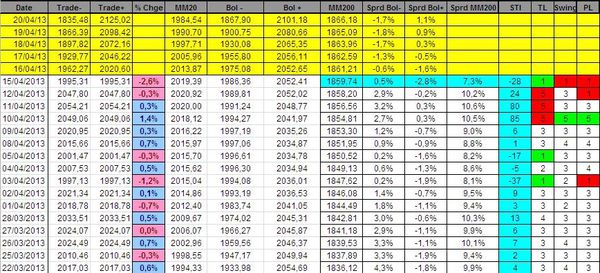
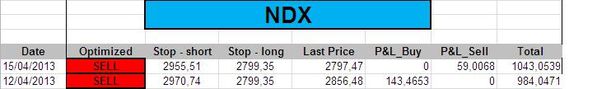
In this context, our short term model remains in sell mode for both the NDX and the SPX. The stop losses moved to 1627.3 (SPX) and 2955.5(NDX):

Conclusion:
Monday's decline was powerful and confirm Friday's sell signal. Nevertheless, as the Swing and the Power Level (PL) are already at '1', it will be important to monitor what will happen on Tuesday: a sharp bounce back could trigger a buy signal (but it is not our core scenario. Nevertheless we have to respect price action if it happens)
Short term positions:
- short 1/2 SPX at 1560.15
- Short 1/2 NDX at 2805.45
- short 1/2 CAC40 at 3754.88
Medium term positions:
- short 3 SPX at 1446.09
- Short 1 NDX at 2758.8
- short 2 CAC at 3251.07
Published by sigmatradingoscillator
-
dans
Market Analysis
14 avril 2013
7
14
/04
/avril
/2013
09:38
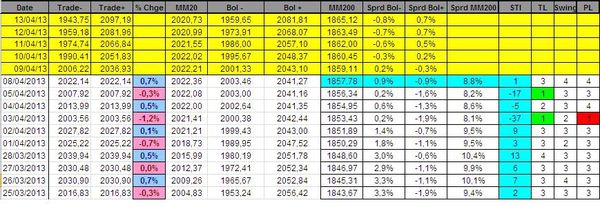
Looking at the chart, Friday's candle looks rather bullish, and it seems we should print a new high early next week.

Looking at our indicators, the Power Level (PL) moved to '1' on Friday. As the trend level was at '5' on Thursday, this generates a sell signal:

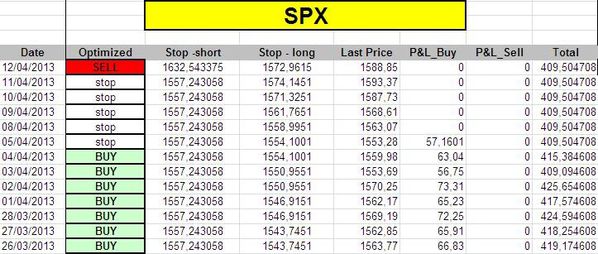
So, our short term model turned short term bearish on both the NDX and the SPX:

Conclusion:
Looking at the chart it seems a new marginal high is possible early next week (but the remaining upside should be very limited).
Our short term model turned negative and a fresh sell signal has been generated on both the SPX and the NDX.
Short term positions:
- short 1/2 SPX at 1560.15
- Short 1/2 NDX at 2805.45
- short 1/2 CAC40 at 3754.88
Medium term positions:
- short 3 SPX at 1446.09
- Short 1 NDX at 2758.8
- short 2 CAC at 3251.07
Published by sigmatradingoscillator
-
dans
Market Analysis
12 avril 2013
5
12
/04
/avril
/2013
10:18
Back from holiday, we resume our daily update.
The market moved sharply higher since our last update and it was able to print a new high. So, our favorite wave count has been invalidated.
There is an alternative wave count, but we don't want to focus too much on it at this time.

Our short term model is now ready to generate a fresh sell signal because the trend Level is at '5'. So if we get a Power Level and/or a Swing at '1' within the next 2 sessions, our model will generate a sell signal.

Conclusion:
Our short term model is ready to generate a fresh sell signal, we need to monitor what will happen in the next 2 sessions.
Short term positions:
- short 1/2 SPX at 1560.15
- Short 1/2 NDX at 2805.45
- short 1/2 CAC40 at 3754.88
Medium term positions:
- short 3 SPX at 1446.09
- Short 1 NDX at 2758.8
- short 2 CAC at 3251.07
Published by sigmatradingoscillator
-
dans
Market Analysis
9 avril 2013
2
09
/04
/avril
/2013
09:09
We are traveling for the time being so we are unable to post daily update. The next update will be done on Friday (based on Thursday's price action).
The market initiated a rebound on Monday (as expected in our week-end comment). It will be crucial to monitor if the market print a new high or not.

Our short term indicators didn't generate any fresh signal:
So, our short term model is in a wait and see attitud for both the NDX and the SPX.
Conclusion:
It seems the market topped few sessions ago and we are probably now in a correction phase.
We have to monitor any bounce back from here and see if it is impulsive or not.
Short term positions:
- short 1/2 SPX at 1560.15
- Short 1/2 NDX at 2805.45
- short 1/2 CAC40 at 3754.88
Medium term positions:
- short 3 SPX at 1446.09
- Short 1 NDX at 2758.8
- short 2 CAC at 3251.07
Published by sigmatradingoscillator
-
dans
Market Analysis
7 avril 2013
7
07
/04
/avril
/2013
12:09
We are traveling for the time being so we are unable to post daily update. The next update will be done on Tuesday (based on Monday's price action).
The market seems unable to continue its advance. We believe the 5th wave probably topped few sessions ago.
Now we are waiting for a confirmation that the top is in. In this context, we need a lower high in coming days (after a short term rebound) followed by a lower low and a move below the pink horizontal line.
Looking at our indicators, the Trend Level (TL) is at '1', telling us we are oversold on a short term basis and that a bounce back could occur. It will be important to monitor if this potential bounce back is impulsive or not.
If we get a Swing and/or a Power Level (PL) at '5' on Monday, we will get a short term buy signal. (If our wave count is right, it should not be the case)

Our short term model hit its stop level on Friday for the SPX. It had already been stopped few days ago for the NDX:

Conclusion:
It seems the market topped few sessions ago and we are probably now in a correction phase. This situation is not in contradiction with our model as it moved neutral for both the NDX and the SPX.
We will have to monitor any bounce back from here (if it happens) and see if it is impulsive or not.
Short term positions:
- short 1/2 SPX at 1560.15
- Short 1/2 NDX at 2805.45
- short 1/2 CAC40 at 3754.88
Medium term positions:
- short 3 SPX at 1446.09
- Short 1 NDX at 2758.8
- short 2 CAC at 3251.07
Published by sigmatradingoscillator
-
dans
Market Analysis


