23 mai 2013
4
23
/05
/mai
/2013
09:28
The market printed a new high, then it reversed and closed near the intraday low:
ST Model (update):


Trading Book:
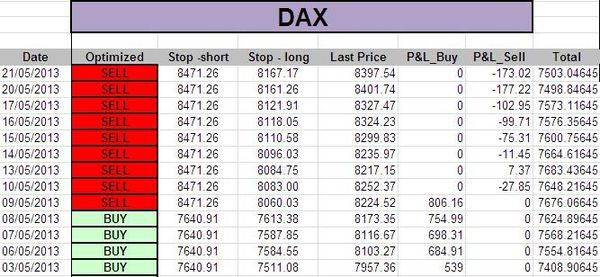
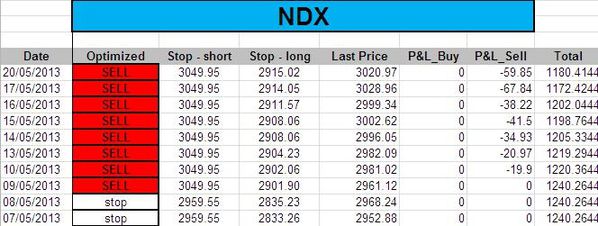
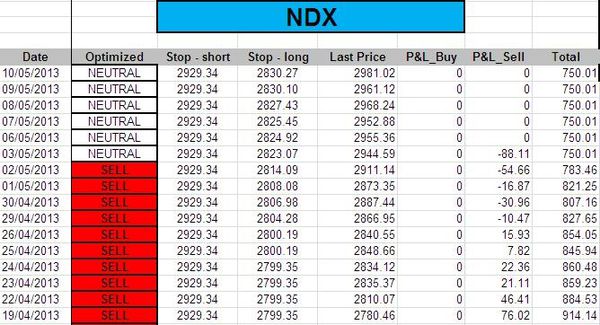
Our short position on the NDX is still alive because our stop was at 3055 (5pts above the model).
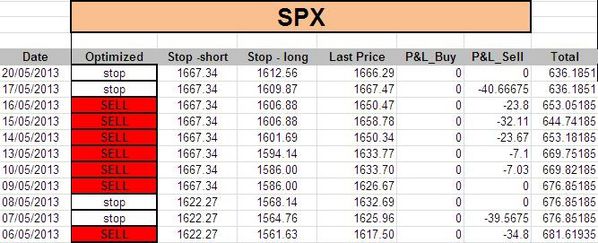
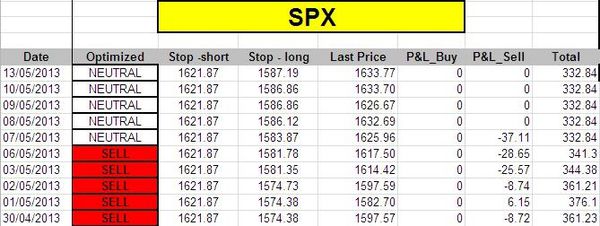
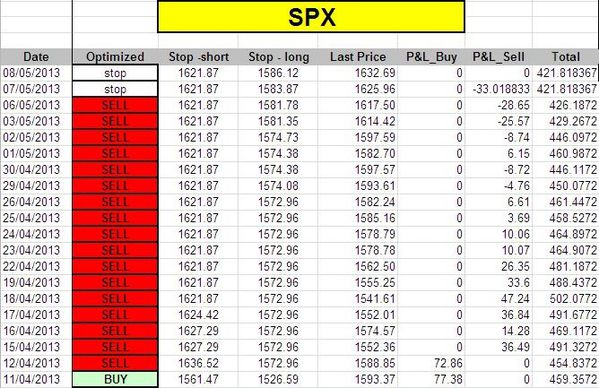
- SPX: no position at this time (model is 'stop')
- NDX: 1 short at 3022.04 (stop @ 3055, 5pts above the model to take into account bid/ask spread)
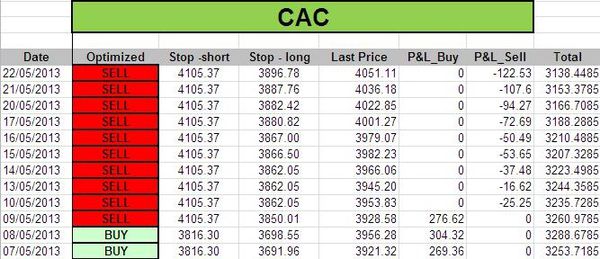
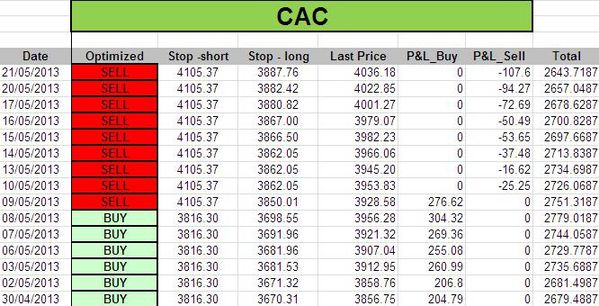
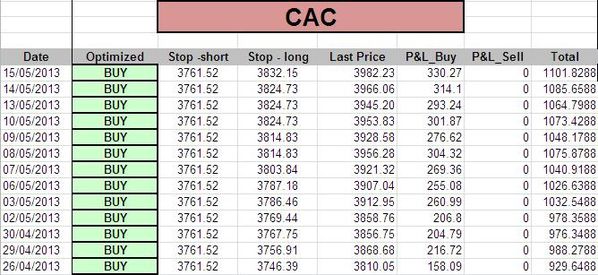
- CAC: 1 short at 4016.98 (stop @ 4110, 5pts above the model to take into account bid/ask spread)
- DAX: no position at this time (model is 'stop')
Published by sigmatradingoscillator
-
dans
Market Analysis
22 mai 2013
3
22
/05
/mai
/2013
15:22
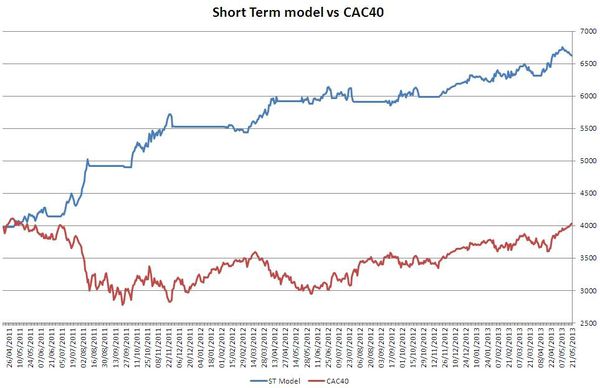
Following an encouraging 2 years back testing on the DAX30, we decided to add it in our current (live) test (with real money).

In this context, we did some minor change in CAC's ST model in order to avoid a perfect match with the DAX => we slightly modified stop loss and take profit levels. Here is the updated P&L of this model on a 2years basis.
ST Model:


Order book:
- SPX: no position at this time (model is 'stop')
- NDX: 1 short at 3022.04 (stop @ 3055, 5pts above the model to take into account bid/ask spread)
- CAC: 1 short at 4016.98 (stop @ 4110, 5pts above the model to take into account bid/ask spread)
- DAX: no position at this time because we are too close from stop level
Published by sigmatradingoscillator
-
dans
Market Analysis
21 mai 2013
2
21
/05
/mai
/2013
08:39
The trend Level is at '4', so there is no chance to get a new signal in coming days:

The SPX remains 'stop' while both the NDX and the CAC remain in 'sell':

Trading Book:
- SPX: no position at this time (model is 'stop')
- NDX: 1 short at 3022.04 (stop @ 3055, 5pts above the model to take into account bid/ask spread)
- CAC: 1 short at 4016.98 (stop @ 4037, 10pts above the model to take into account bid/ask spread)
Published by sigmatradingoscillator
-
dans
Market Analysis
17 mai 2013
5
17
/05
/mai
/2013
09:41
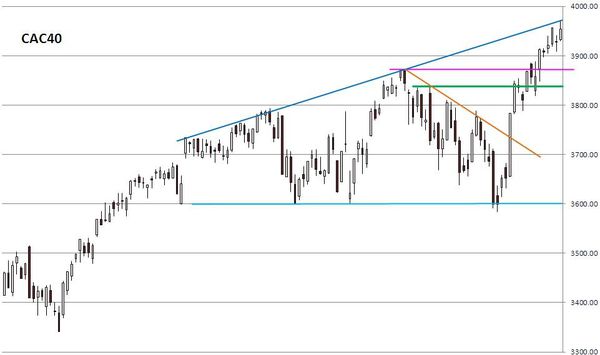
Both the US market and the French CAC40 remain at the top of the pattern. There is no sign of reversal at this stage.

There is no change in our short term indicator.
Conclusion:
We continue to expect a short term pullback from current levels, but as there is no chance to get a fresh sell signal from our short term model now (market isn't anymore overbought on a ST basis), we will close our short term short after a 3 to 5% decline.
We will present our new medium term model based on weekly data. In this context, we booked our medium term losses, and we will start to test (live) the "new" model on Monday the 20th of May. More details during the week-end.
We have to admit that previous medium term model was a failure.
Short term positions:
- short 1/2 CAC40 at 3981.72 ( stop loss at 3998)
- 1/2 SP500 at 1647.03 (stop loss at 1660)
- 1/2 NDX at 3000.09 (stop loss at 3020)
Medium term positions:
no more positions
Published by sigmatradingoscillator
-
dans
Market Analysis
16 mai 2013
4
16
/05
/mai
/2013
07:25
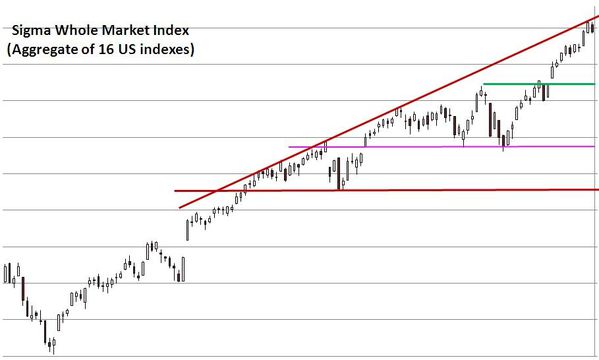
Looking at the charts, it is easy to notice that both the US Sigma Whole Market Index and the French CAC40 are just below their ascending resistance. Does it mean we will go down right now? Not necessarily, because we can follow this line for a couple of days (like the CAC40 is currently doing) or we can break it.
Nevertheless, after the strong move we got last weeks, we would be very surprised to get a breakout without any pullback at this level. So, we consider there is a high probability that the market does an healthy pullback of 3 to 5% (at least) in coming sessions.

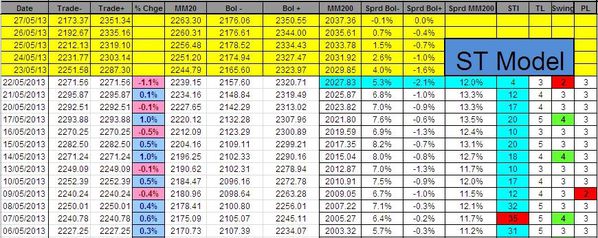
There is no new signal coming from our indicators. Moreover, as the Sigma Trend Index (STI) is relatively low (20 for US and 8 for CAC40), there isn't any chance to get a sell signal around these levels.

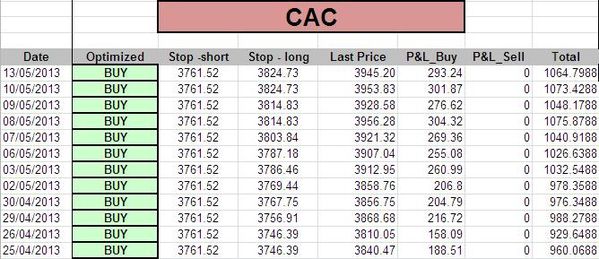
There is no change in our short term model, neutral for both the NDX and the SPX, buy mode for the CAC40:

Conclusion:
We expect a short term pullback at current levels, but as there is no chance to get a fresh sell signal from our short term model at this stage, we will close our short term short after a 3 to 5% decline.
Short term positions:
- short 1/2 CAC40 at 3981.72 ( stop loss at 4010)
- 1/2 SP500 at 1647.03 (stop loss at 1670)
- 1/2 NDX at 3000.09 (stop loss at 3020)
Medium term positions:
- short 3 SPX at 1446.09
- Short 1 NDX at 2758.8
- short 2 CAC at 3251.07
Published by sigmatradingoscillator
-
dans
Market Analysis
15 mai 2013
3
15
/05
/mai
/2013
09:18
The US equity market continued its advance on Tuesday, and we are now very close to the red ascending line (around0.5%). There is no sign of reversal at this stage, but it should be difficult to go trough this resistance on a straight line. Even if we move above this line in coming weeks, we should (at least) have a pullback before.

The French market is just below the blue ascending line. It is interesting to notice that this market is not able to continue its advance (for the time being) even if the US market remains very strong. We consider that as long as we remain below this blue ascending line, there is an attractive risk/return for a short position.

There is no new information coming from our indicators: there is no indicator at 'extrem' level.

So, there is no change in our short term model: neutral on both the NDX and the SPX, long on the CAC40:


Conclusion:
Due to very strong resistances close to current levels, we expect (at least) a pullback in coming sessions.
We took a small short position on the CAC40 due to the blue ascending resistance. If the market is able to close above this level, we will close our short and re-long because we don't want to 'fight' our own model.
If we move above our stop loss in the US, we will remain on the sideline, waiting for a signal from our short term model.
Short term positions:
- short 1/2 CAC40 at 3963.67 ( stop loss at 3977)
- 1/2 SP500 at 1647.03 (stop loss at 1660)
- 1/2 NDX at 3000.09 (stop loss at 3007)
Medium term positions:
- short 3 SPX at 1446.09
- Short 1 NDX at 2758.8
- short 2 CAC at 3251.07
Published by sigmatradingoscillator
-
dans
Market Analysis
14 mai 2013
2
14
/05
/mai
/2013
08:46
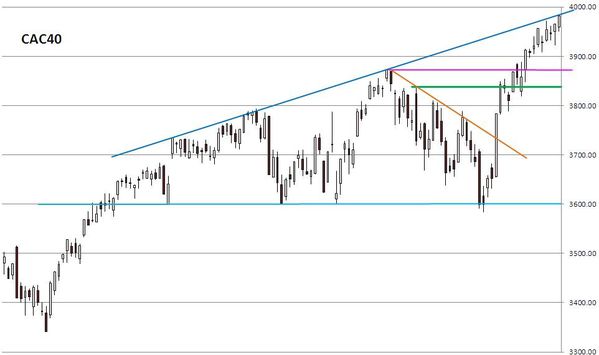
It is interesting to notice that the CAC40 reached the blue ascending line while US market didn't reach this level.
So, it is important to monitor if the French market can move above this trend line or not. A close above this ascending trend line would clear the way for 4200 (5% upside).
Once again, there is no sign of reversal at this stage, but both the US and the French markets printed a 'doji' on Monday, this tells us there are some uncertainties at this stage.


There is nothing special in our short term model: all indicators are neutral (at '3').

So, our short term model remains neutral on both the SPX and the NDX while it remains in buy mode on the CAC40:

conclusion:
If the CAC40 is able to close above the blue ascending line, we will re-enter long on the French market. But we are now neutral on this market because there is a risk to roll down to 3600 (horizontal support).
We have no short term position on the US, we are waiting for a new short term signal.
Short term positions:
no more position
Medium term positions:
- short 3 SPX at 1446.09
- Short 1 NDX at 2758.8
- short 2 CAC at 3251.07
Published by sigmatradingoscillator
-
dans
Market Analysis
11 mai 2013
6
11
/05
/mai
/2013
07:20
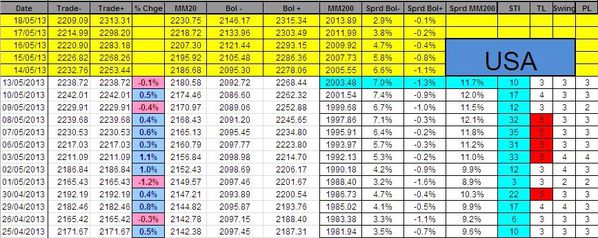
The US market remains very well oriented, and there is no sign of reversal at all. The red ascending line is still rather far from current levels (1.4% above current levels).

Looking at the French market, the situation is different because the market reached the blue ascending line.
So, according to the historical data of this pattern ( http://www.thepatternsite.com/rabfa.html ), the 2 possible outcomes are 3480 or 4220.
Our US indicators were not able to generate a new signal, the situation is unchanged in France:


So, the short term model remains neutral on both the NDX and the SPX, and in buy mode on the CAC40


Conclusion:
Our model wasn't able to generate a fresh sell signal on the US.
The French market is now at the top of its broadening pattern, we are ready to act.
Short term positions:
no more position
Medium term positions:
- short 3 SPX at 1446.09
- Short 1 NDX at 2758.8
- short 2 CAC at 3251.07
Published by sigmatradingoscillator
-
dans
Market Analysis
9 mai 2013
4
09
/05
/mai
/2013
08:23
The US market continues to climb, and we are not far from a resistance (red ascending line). Looking at both red lines, we can notice a triangle pattern (similar to the one we have on the CAC40).
There is no sign of reversal at this stage.

The CAC40 closed the regular session at 3956.28.
At this level, it was close to the blue ascending line but didn't touch it. But, during the extended hours (US session), the CAC's CFD traded as high as 3967 and was right on the ascending line.
This morning, the CAC's CFD opened well below the 3967 (at 3938). It looks like the market doesn't want to move above this blue ascending line. This is a warning signal for the market (just a warning, no more).

The Trend Level (TL) is at '5' in both USA and France. This means that if we get a '1' on the Swing indicator or on the Power Level on Thursday or on Friday, this will generate a sell signal.


Our short term model is neutral on both the NDX and the SPX, and it is in 'buy' mode on the CAC40:

Conclusion:
We are short term neutral at this time, and we are waiting for a fresh sell signal.
Short term positions:
no more position
Medium term positions:
- short 3 SPX at 1446.09
- Short 1 NDX at 2758.8
- short 2 CAC at 3251.07
Published by sigmatradingoscillator
-
dans
Market Analysis
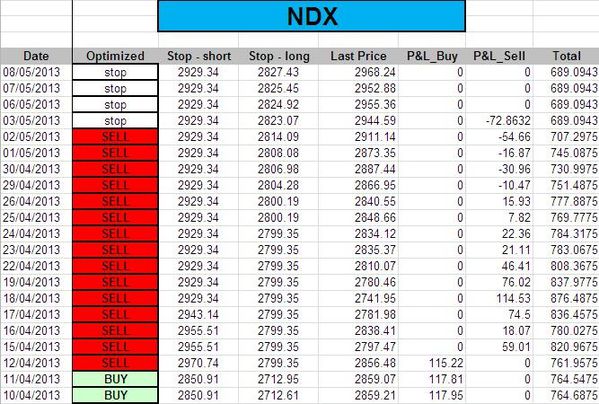
8 mai 2013
3
08
/05
/mai
/2013
08:58
The US market continues to rise, it seems like nothing can stop it.
The bottom of red uptrend could offer some kind of resistance to the market, but we don't consider it as a strong resistance.

The CAC40 continues to rise and we are now close to an important resistance (blue ascending line). It will be key to monitor how the market reacts when it reaches this level(have a look at week-end analysis for more details on this pattern).

Looking at our US indicators, the trend level (TL) remains in overbought territory (at '5'), but there is not sign of reversal coming from the Swing and/or the Power Level (PL)

Even if the CAC40 experienced a strong rally in recent days, it is not overbought at this time because the Trend Level is at 4. Once again, there is no sign of reversal because both the swing and the power level (PL) are at '3' (neutral).

Our short term model was stopped yesterday on the SPX, there is no change to the CAC40:


Conclusion:
US markets are in overbought territory, true, but there is no sign of reversal at this time. On top of that, the short positions we initiated at the top of the market (in March) were stopped on both the NDX and the SPX (losses around 3% on each positions)
The long position on the CAC40 remains open at this time.
Short term positions:
- long 1/2 CAC40 at 3905.63
Medium term positions:
- short 3 SPX at 1446.09
- Short 1 NDX at 2758.8
- short 2 CAC at 3251.07
Published by sigmatradingoscillator
-
dans
Market Analysis


