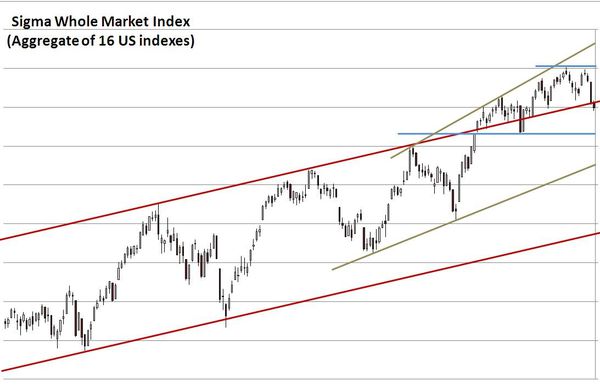
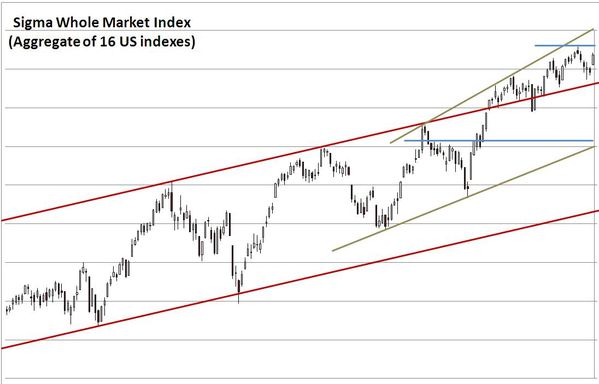
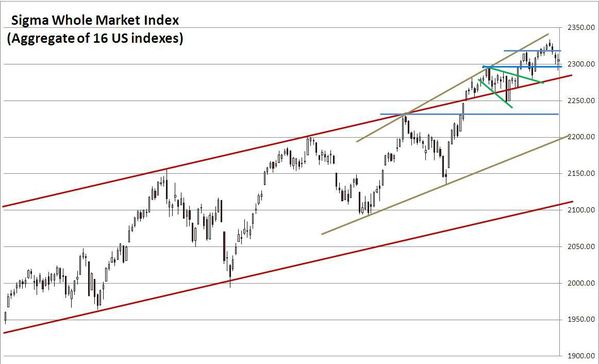
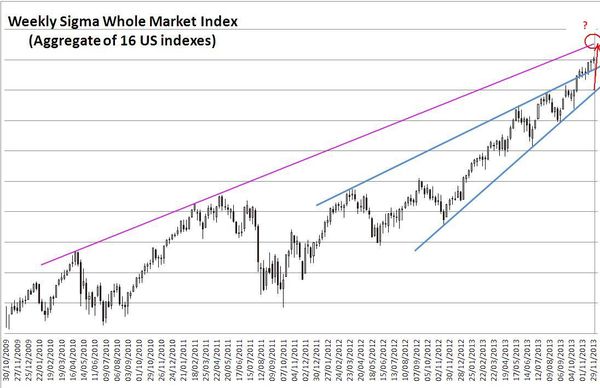
The Sigma Whole Market Index continues to climb, day after day, week after week. I knwo a lot of investors don't share my opinion, but for me there is no doubt, we are in the late stage of a bubble powered by the Fed easy money policy and this will end very badly. How long can it last before we reach the top? I really don't know. But at this stage in the bubble, we will probably continue to accelerate in an asymptotic move until we hit the wall like we did in 2000 (for those of you interested in this subject, I added a youtube's link in Thursday's daily comments).
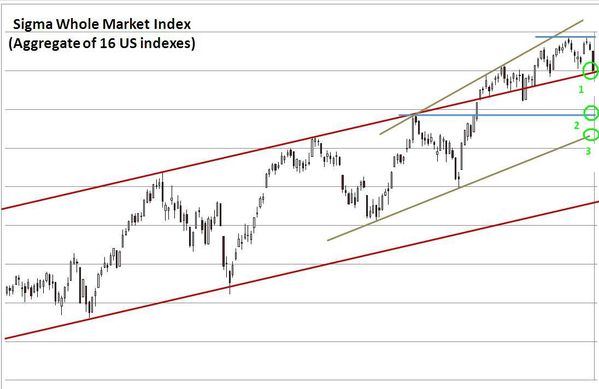
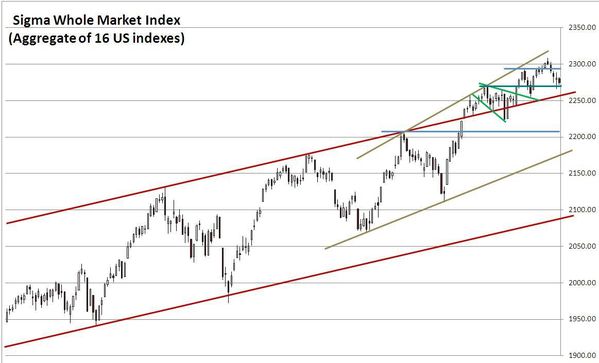
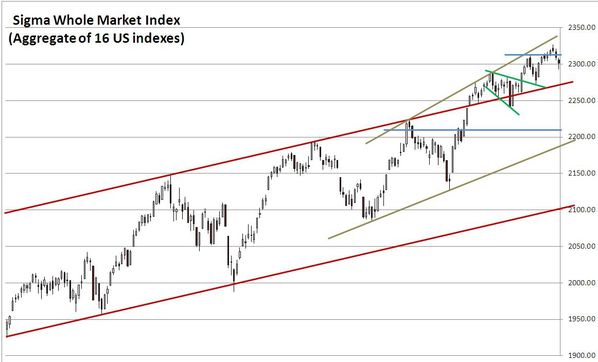
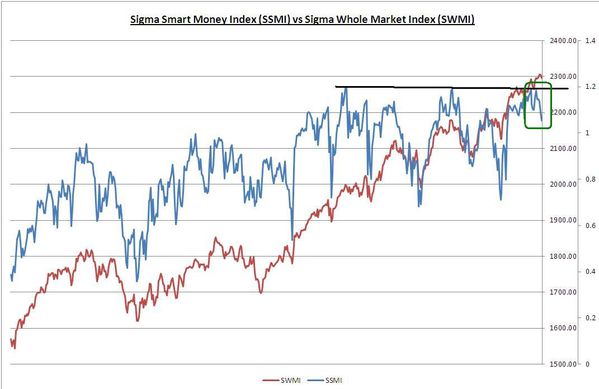
We can notice on the Sigma Whole Market index (weekly) chart that we are not far from an important resistance (pink line, =~2.5% upside from current levels). It will be interesting to see if this level act as a resistance (at least short term) or if the market continues to accelerate when it reaches this level.
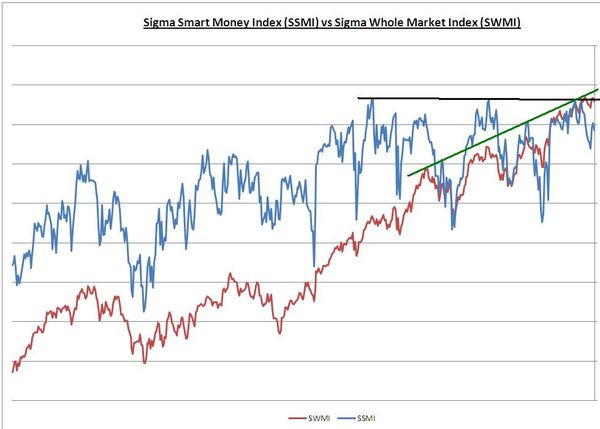
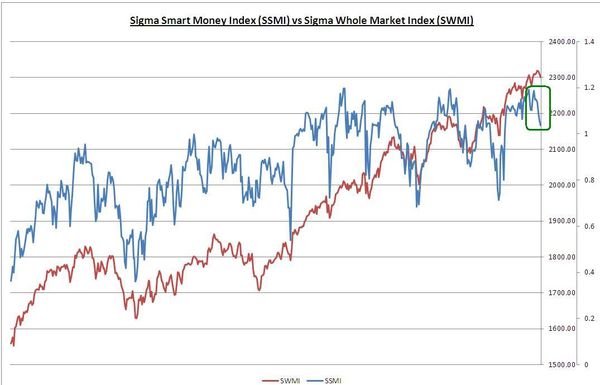
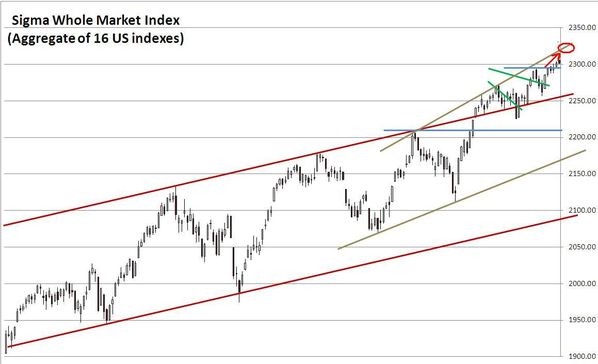
Looking at the Sigma Smart Money Index (blue line), it is interesting to notice that current top remains below 2007's top. So, the negative divergences between the Sigma Whole Market Index and the Sigma Smart Money Index are very important because we have divegences on both short term and medium term.
Sigma Smart Money Index = log (Sigma Whole Market Index / Vix ^2)

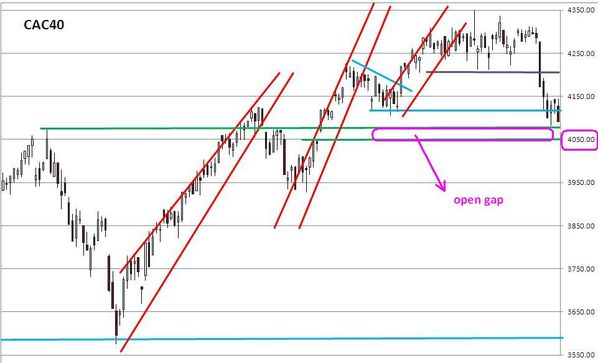
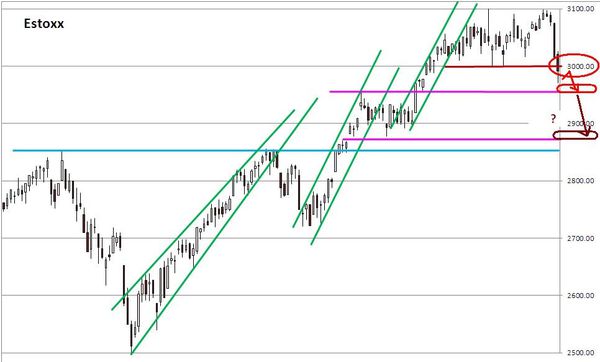
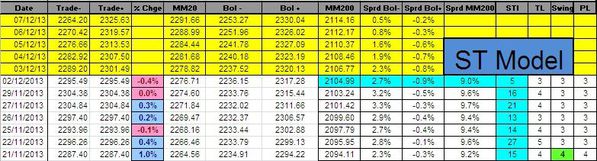
Looking at the Sigma Whole Market Index on a daily basis, the situation is rougly the same than on the weekly chart; the next resistance is roughly 2% above Friday's close. Looking at the chart, it is clear we are in an acceleration phase: trend channel are steeper and steeper. We wouldn't be surprised to see further acceleration in the short momentum.
The end of last week made a lot of damages in our book: we were stop on 2 short positions (NDX & DAX). We want to continue to test our model (even in a bubble period) but at this time we are close to roll in negative P&L for H2. In this context, we decided to cover our book against a bubble blow off by buying a January Call on the NDX (strike 3700) @ 5.06.
NDX: 1 short @ 3361.01, stopped @ 3475.13 => -144.12 pts (loss)
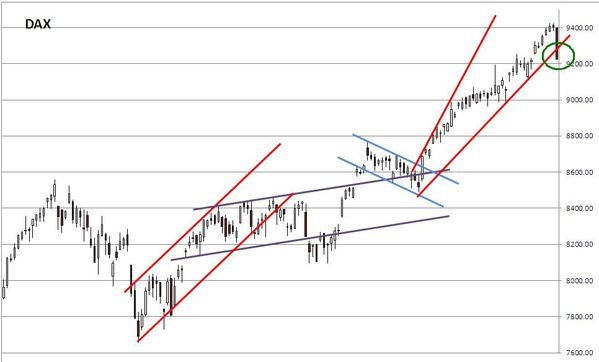
DAX: 1 short @ 9193.36, Stopped @ 9379.17 => -185.81 pts (loss)
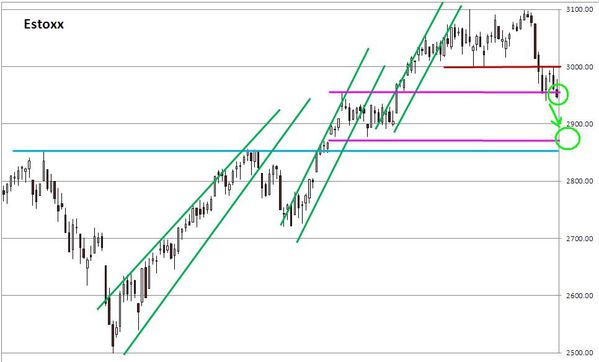
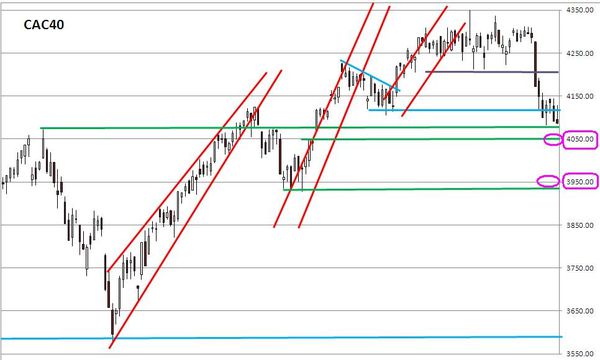
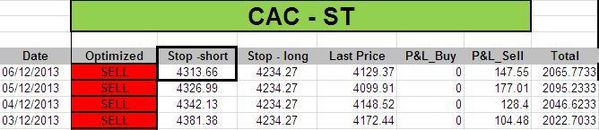
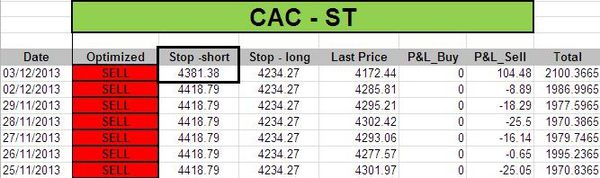
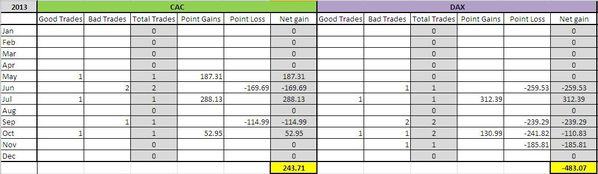
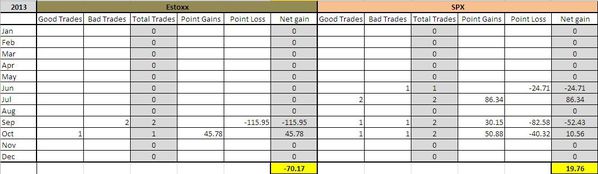
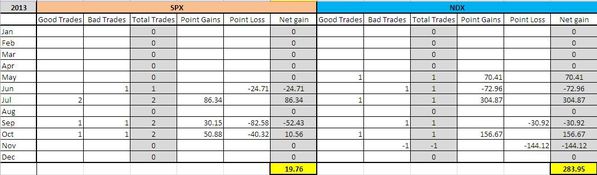
As we hit several stops in recent weeks, we believe it is interesting to summarize our P&L since we started to test current model (in early may 2013). To make it simple, we are booking big gains on both the CAC & NDX, we are roughly flat on both the SPX & EuroStoxx and we have big losses on the DAX.
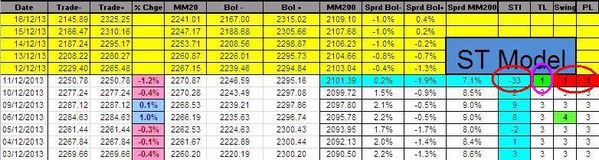
Short Term Trading Book:
- SPX: short at 1792.26 (stop @ 1827, 3pts above the ST model to take into account bid/ask spread)
- NDX: stopped
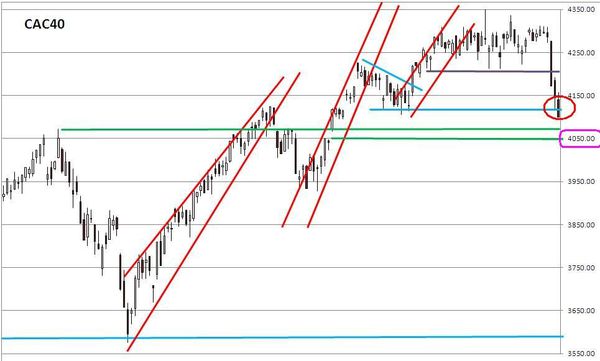
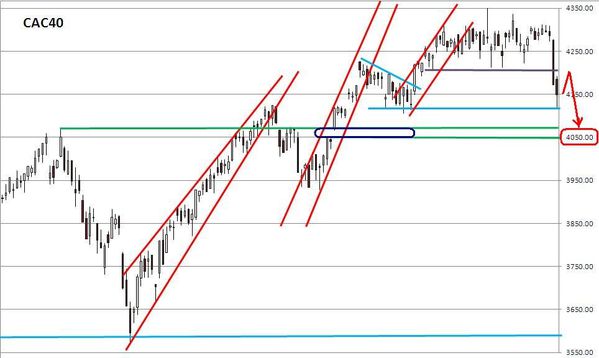
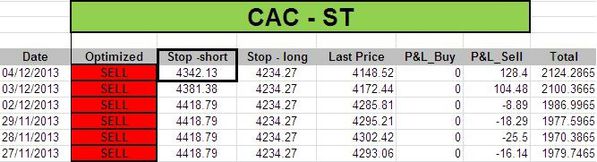
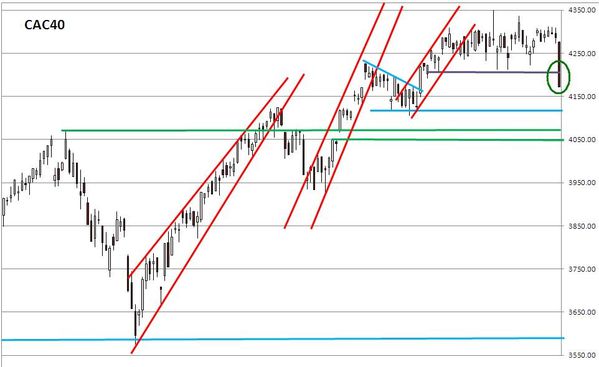
- CAC: short at 4272.14 (stop @ 4423, 5pts above the ST model to take into account bid/ask spread)
- DAX: stopped
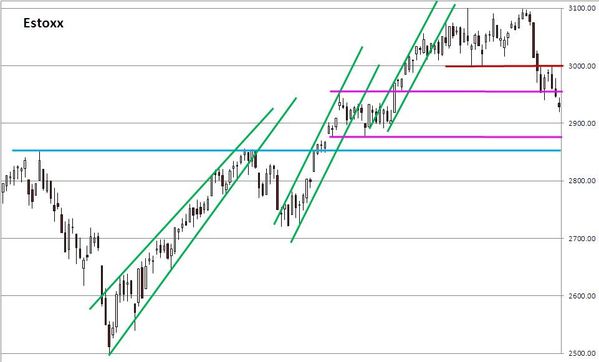
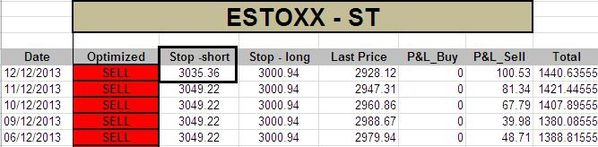
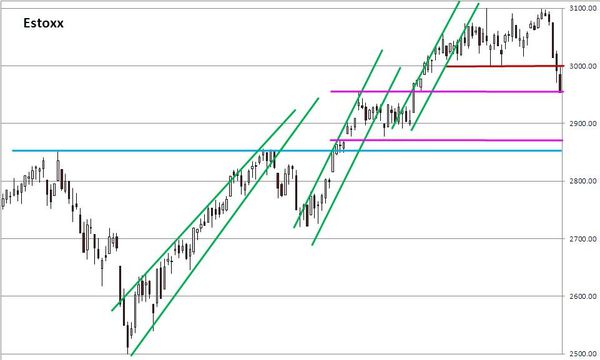
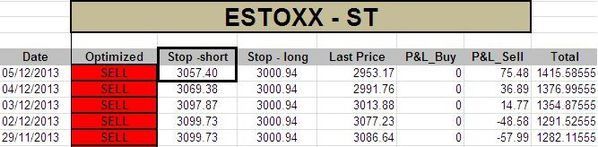
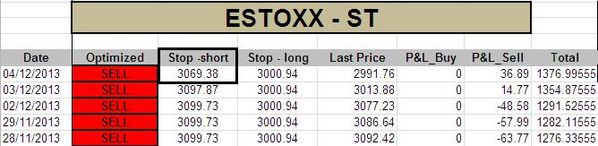
- EStoxx: short at 3027.17 (stop @ 3105, 5pts above the ST model to take into account bid/ask spread)
Medium Term Trading Book:
- No more medium term position at this stage.
Out of model position:
- 1 call NDX January 2014 strike 3700 @ 5.06