Here is our in depth weekly update.
Medium Term View
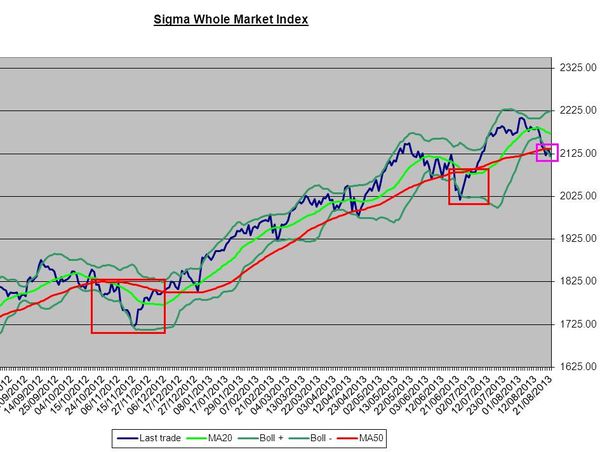
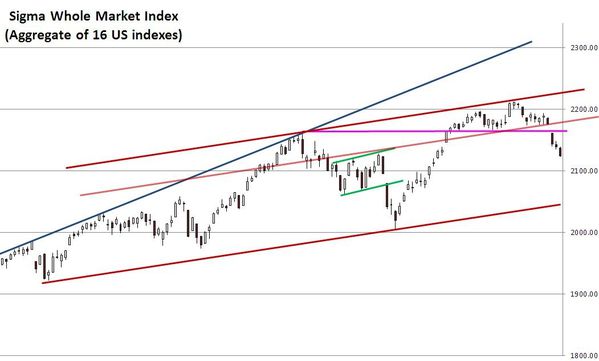
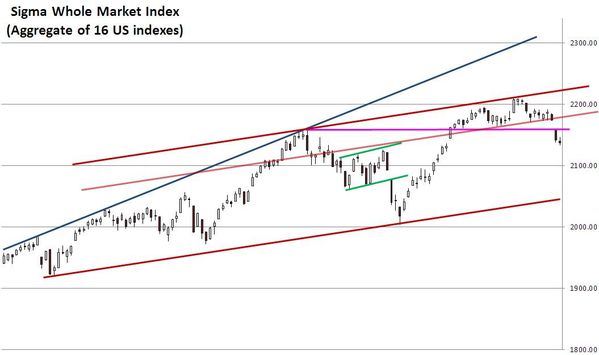
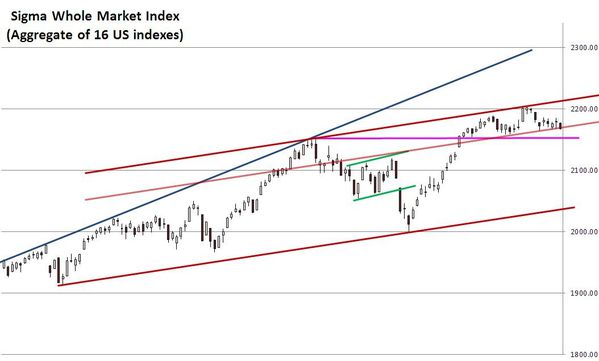
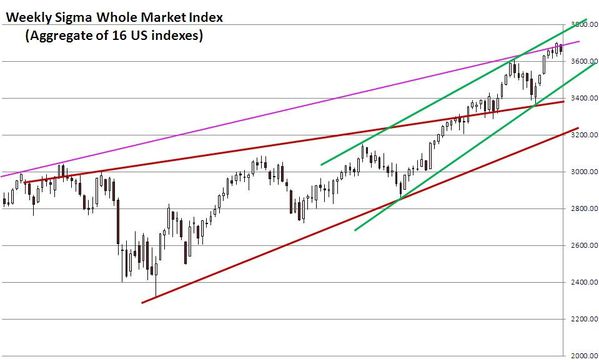
When we look at the weekly chart of the Sigma Whole Market Index (aggregate of 16 US indexes), it seems there is no immediate danger to the uptrend: the market was able to breakout the red rising wedge to the upside and he is now in a new (green) rising wedge.
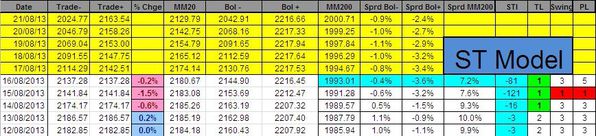
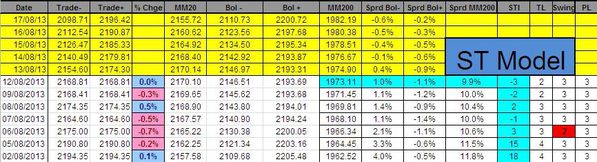
Nevertheless, when we look at our Mt model (MT model), we can notice our weekly PL (power level) came in at '2' this week (mild negative impulse).This is a warning signal.

On top of that, the weekly sell signal we got end of May is still valid because the stop hasn't been reached yet.

Short Term View
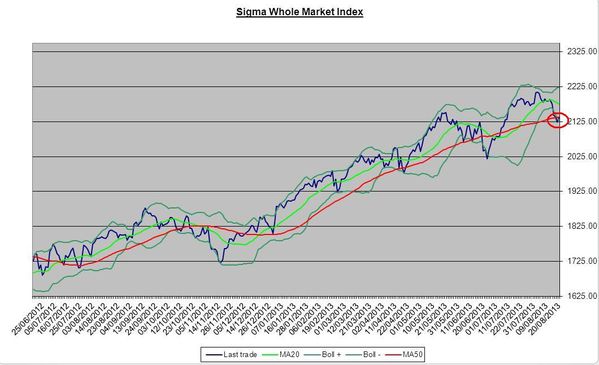
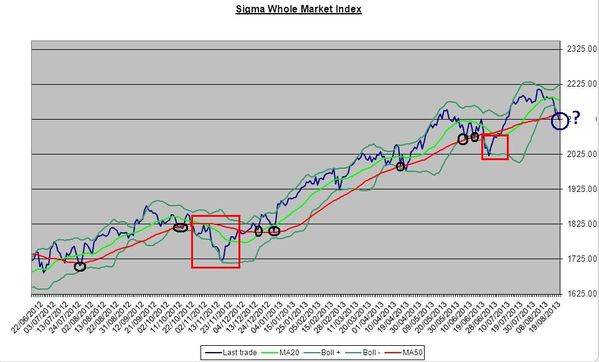
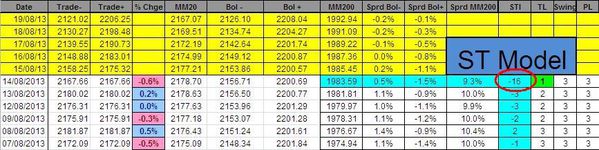
When we look at the Sigma Trend Index and the Sigma Whole Market Index on the same chart, we can clearly identify a negative divergence between the red and the blue line. This means that even if the market continues to rise (blue line), the internal dynamic is weakening.
Now, it becomes more dangerous because the Sigma Trend Index (red line) slid in negative territory. So, the market is in danger and it is important the STI moves back in positive territory or we could get an acceleration to the downside.

When we look at the daily chart of the Sigma Whole Market Index, we can notice the market remains above the key (pink) horizontal support. We can consider the uptrend remains valid as long as this support holds on.

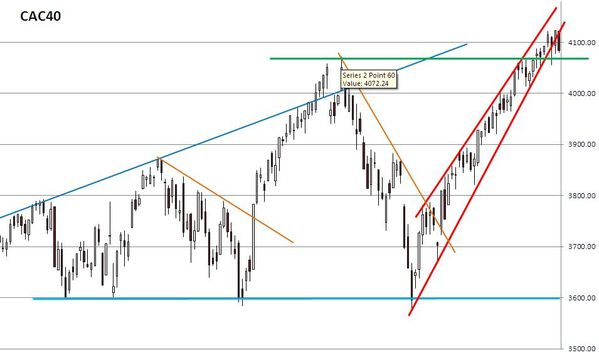
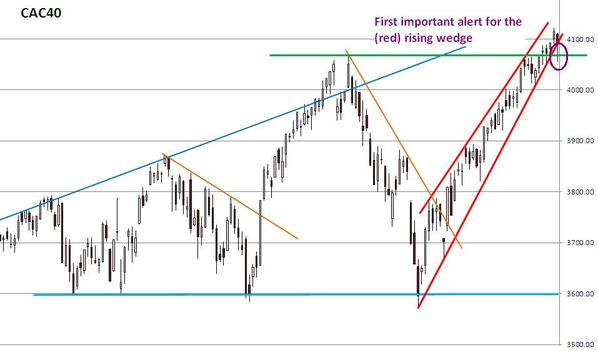
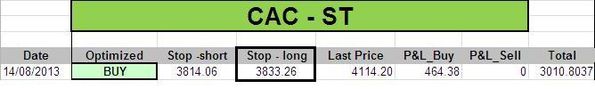
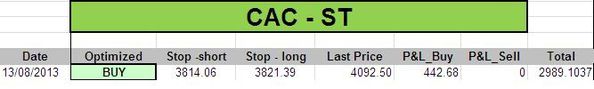
When we look at the chart of the CAC40, we can notice the index is in a very steep rising wedge. The CAC is also close to its top of May. So, we could be at risk of an important double top if we reverse from here.

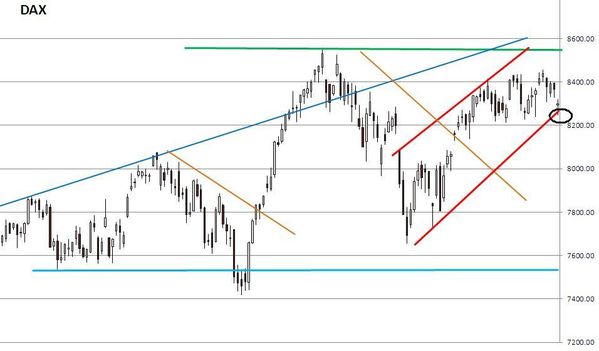
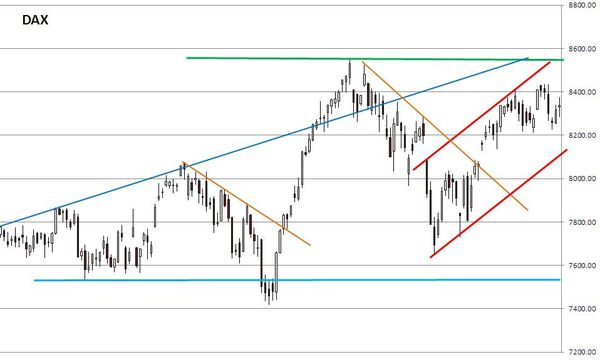
Looking at the DAX, we can notice that recent rebound was much weaker than the one achieved by the CAC. It is also an important shift in the market because since 2009 the DAX has been the clear leader in Europe. So, when the leader starts to weaken, it is always a warning signal.
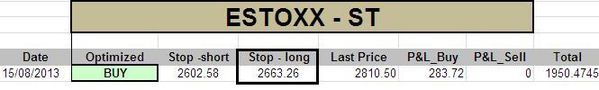
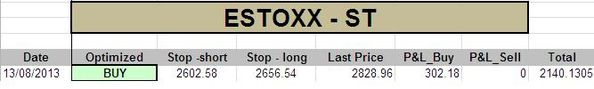
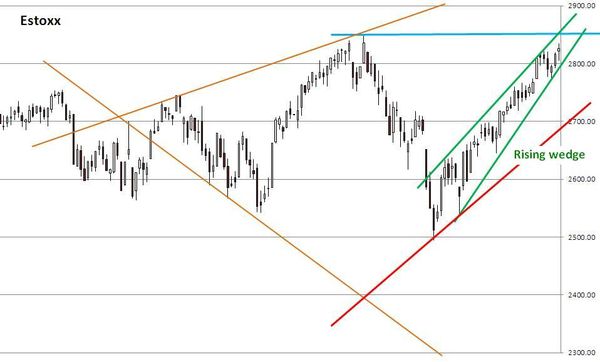
When we look at the chart of the Eurostoxx50, we can notice the situation is similar to the CAC one. So, we can conclude that financials are now outperforming industrials in Europe because CAC and Estoxx are heavy weighted in financials while DAX is heavily weighted in industrials.
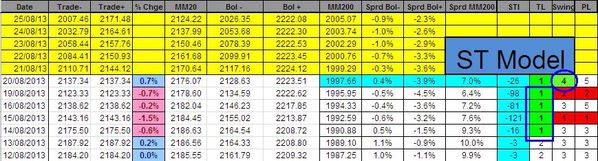
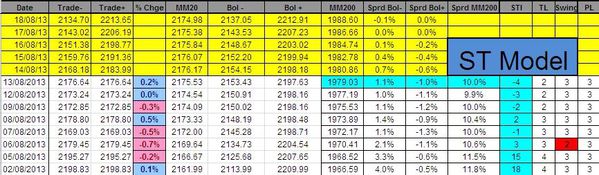
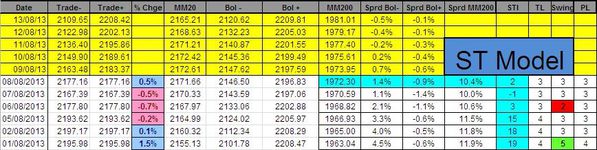
Nevertheless, there is no big change in our indicators: both the Swing and the power level (PL) are neutral at '3':
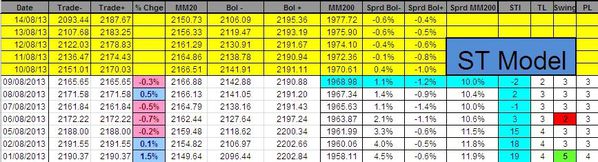
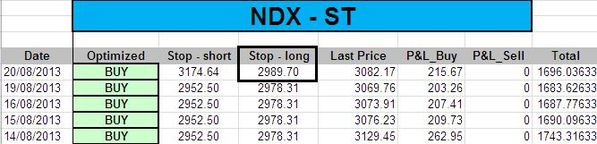
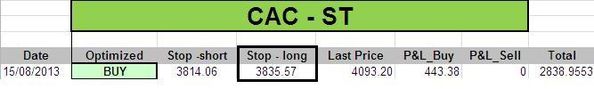
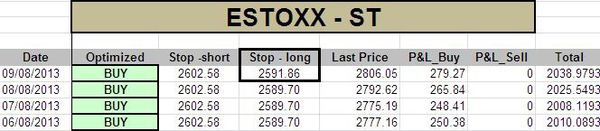
The ST model uplifted its stops on both the CAC and the Estoxx. Other indexes are unchanged.

Short Term Trading Book:
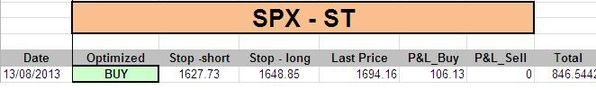
- SPX: 1 long at 1588.17 (stop @ 1603, 3pts below the ST model to take into account bid/ask spread)
- NDX: 1 long at 2868.65 (stop @ 2863, 5pts below the ST model to take into account bid/ask spread)
- CAC: 1 long at 3657.24 (stop @ 3745, 5pts below the ST model to take into account bid/ask spread)
- DAX: 1 long at 7817.14 (stop @ 7856, 10pts below the ST model to take into account bid/ask spread)
Medium Term Trading Book:
- SPX: 2 shorts at 1682.84 (stop @ 1724, 3pts above the MT model to take into account bid/ask spread)