The end of the year and the first week of the new year are usually very good for equity market. Nevertheless, there are some exception such as in 2008.
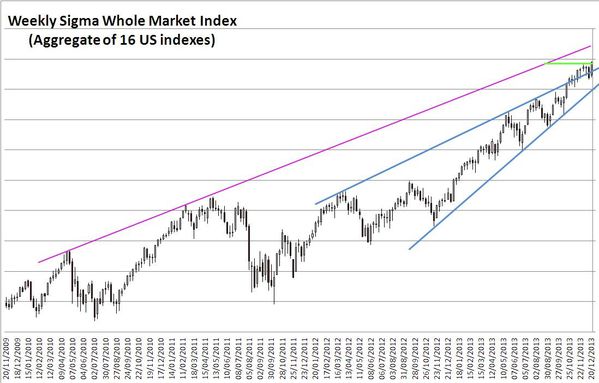
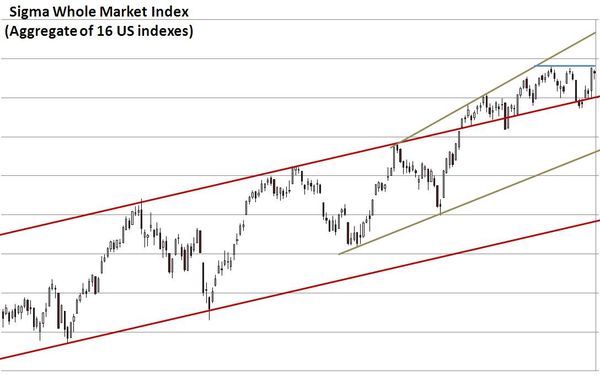
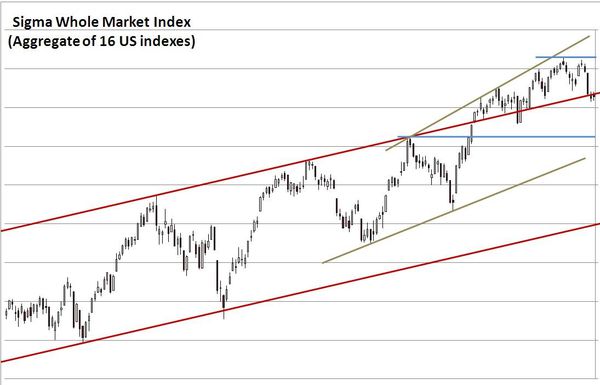
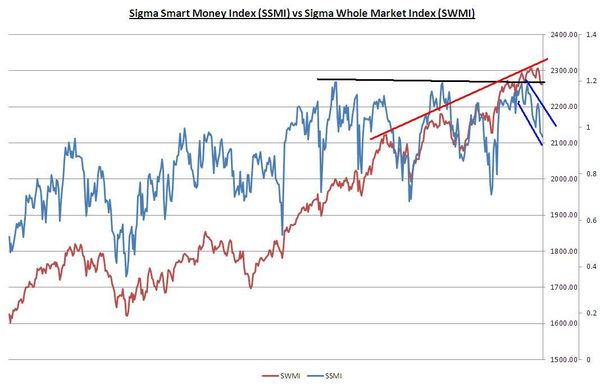
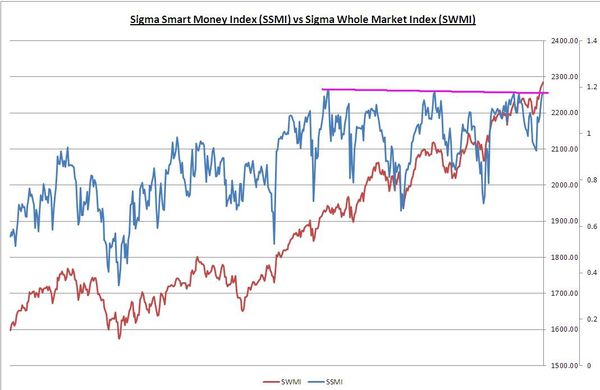
Looking at the chart of the Sigma Whole Market Index, the chart remains well oriented. The last upleg is rather vertical and unsustainable on a medium term basis, but we could climb a little bite more in order to reach the next resistance.

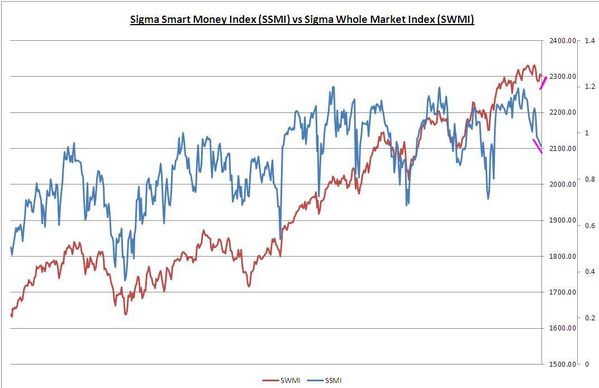
The negative divergence between the Sigma Smart Money Index and the Sigma Whole Market Index remains in place at this stage. The SSMI wasn't able to print new high.
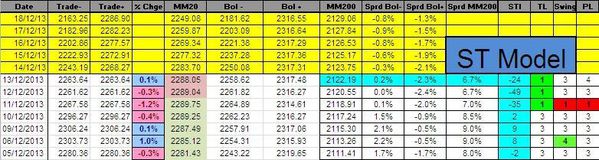
Looking at our indicators, the Sigma Trend Index remains above the key '34' level for the 3rd consecutive session. This is quiet unusual but thanks to seasonality, this could last one more week (at best).

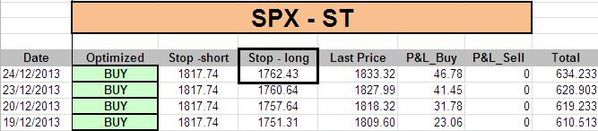
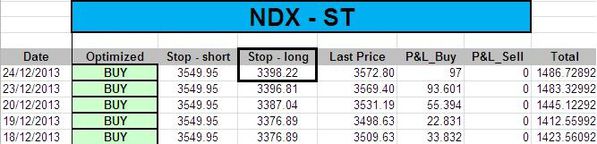
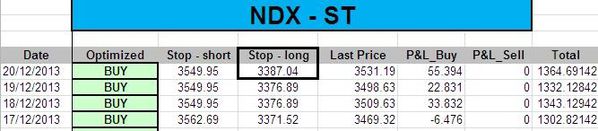
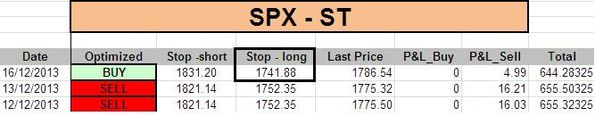
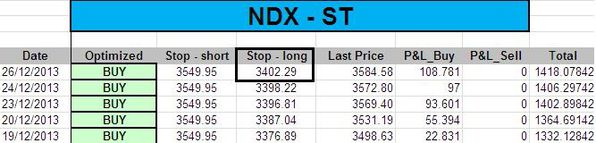
The ST model computed new stop levels on both the NDX and the SPX:
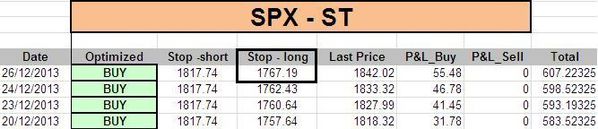
Short Term Trading Book:
- SPX: long at 1787.18 (stop @ 1764, 3pts below the ST model to take into account bid/ask spread)
- NDX: long at 3475.53 (stop @ 3397, 5pts below the ST model to take into account bid/ask spread)
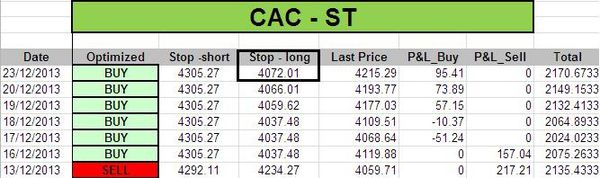
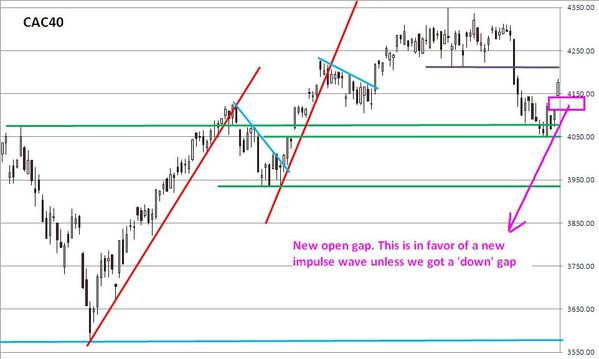
- CAC: long at 4115.38 (stop @ 4073, 5pts below the ST model to take into account bid/ask spread)
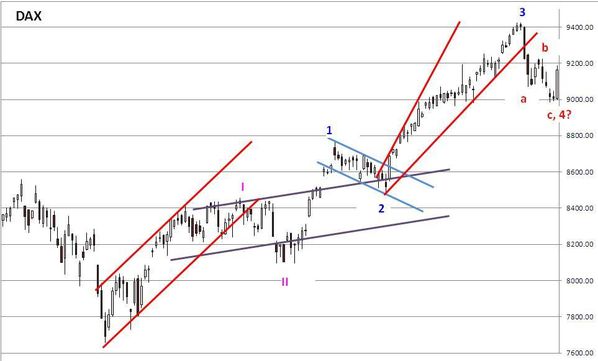
- DAX: long at 9164.04 (stop @ 8958, 10pts below the ST model to take into account bid/ask spread)
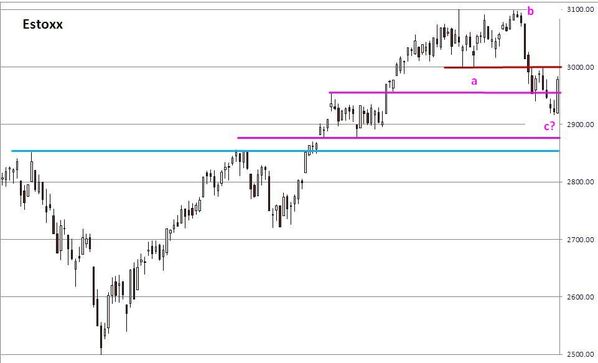
- EStoxx: long at 2974.13 (stop @ 2918, 5pts below the ST model to take into account bid/ask spread)
Medium Term Trading Book:
- No more medium term position at this stage.
Out of model position: (in case of a blow off rally like in 2000)
- 1 call NDX January 2014 strike 3700 @ 5.06