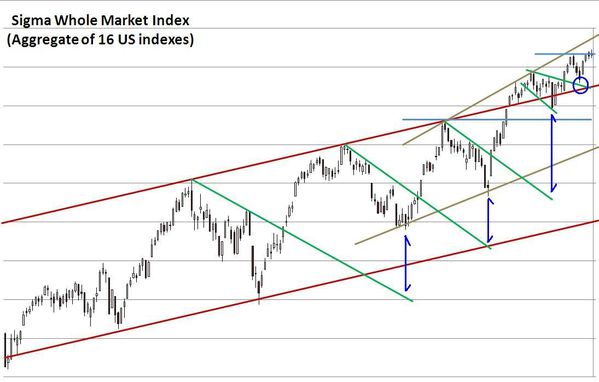
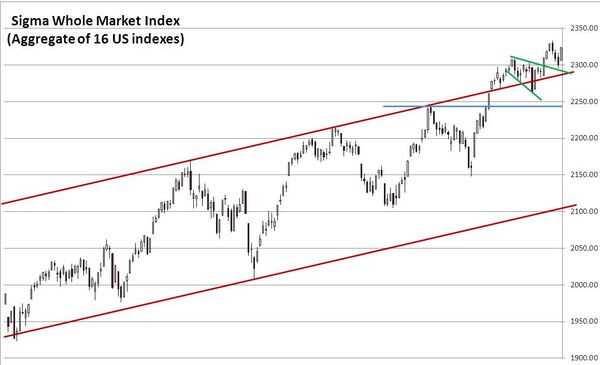
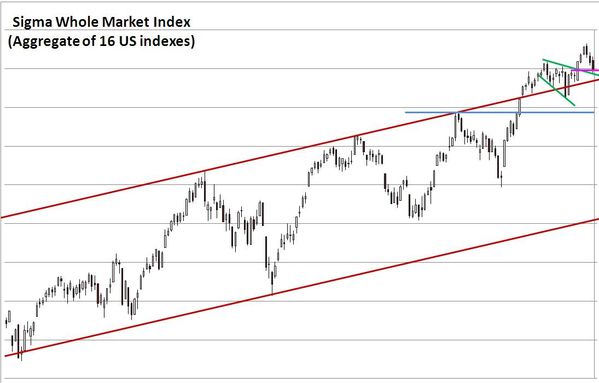
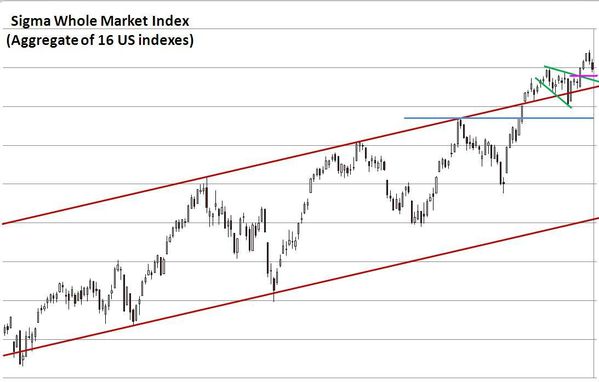
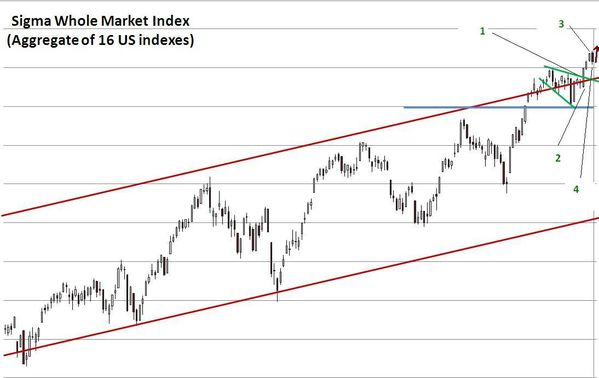
It is very impressive to see the market going up day after day without any real sign of pullback. It seems we are in a blow off top situation, and in this situation our model is worthless.
This presentation from D. Sornette on bubbles and blow off tops is very interesting: http://www.youtube.com/watch?v=C_eFjLZqXt8 .

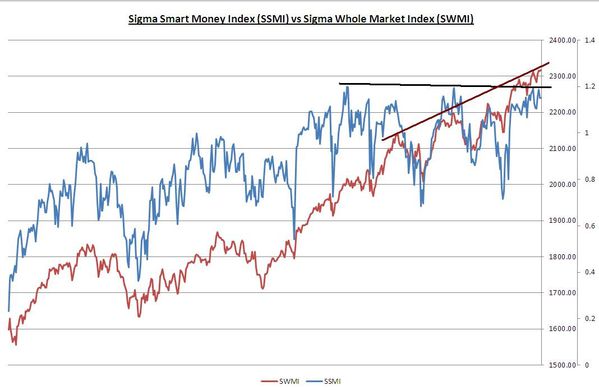
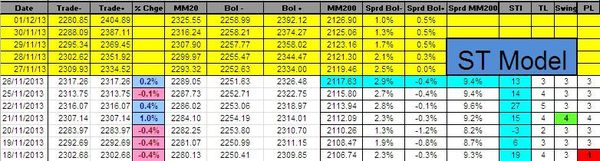
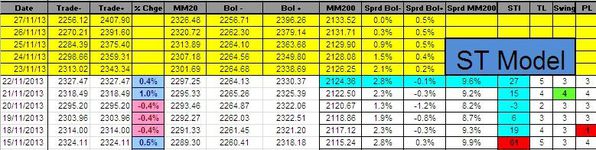
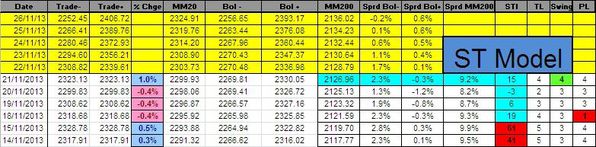
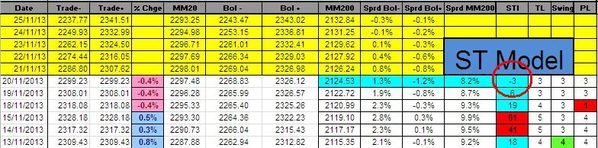
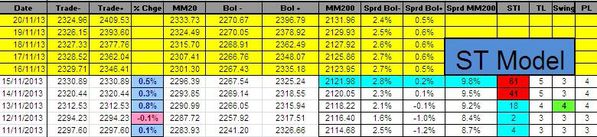
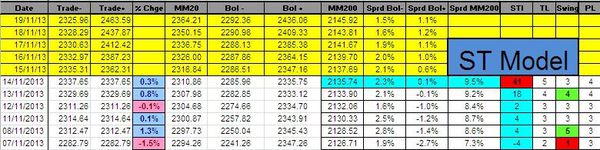
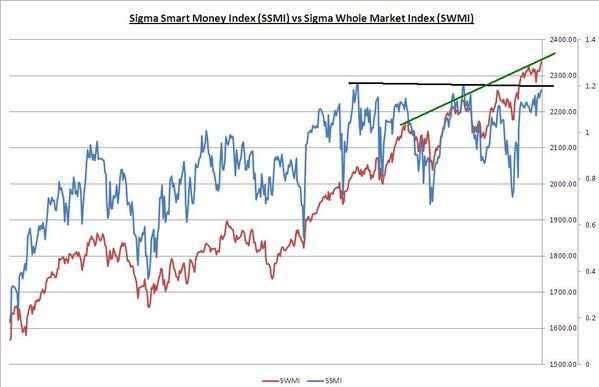
There is no new information in our indicators:

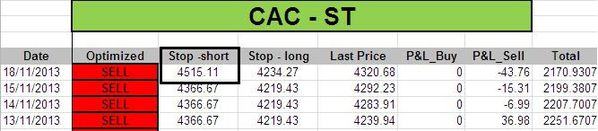
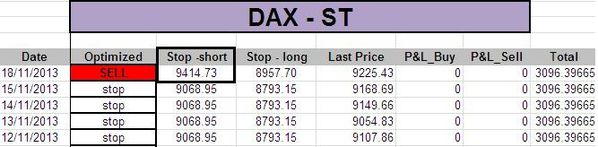
We are very close to some stops. This rally is eating most of the profits we generated this year.
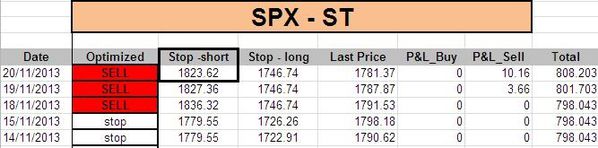
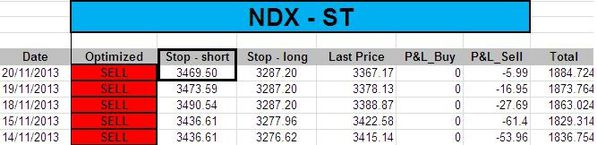
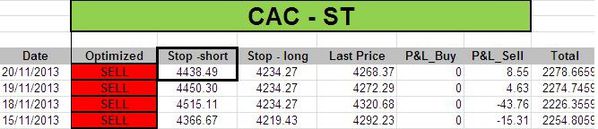
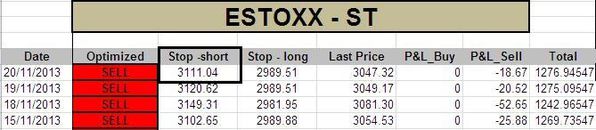
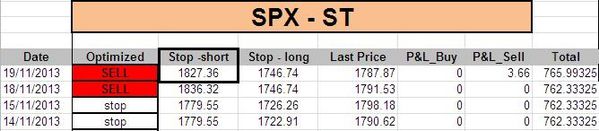
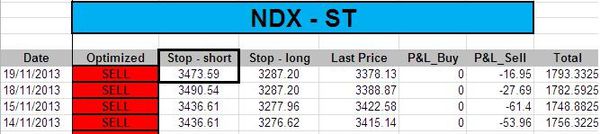
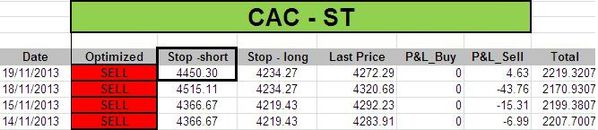
Short Term Trading Book:
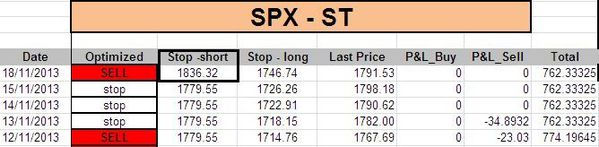
- SPX: short at 1792.26 (stop @ 1827, 3pts above the ST model to take into account bid/ask spread)
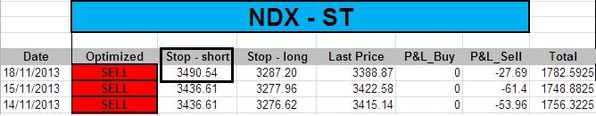
- NDX: short at 3361.01 (stop @ 3475, 5pts above the ST model to take into account bid/ask spread)
- CAC: short at 4272.14 (stop @ 4423, 5pts above the ST model to take into account bid/ask spread)
- DAX: short at 9193.36 (stop @ 9379, 10pts above the ST model to take into account bid/ask spread)
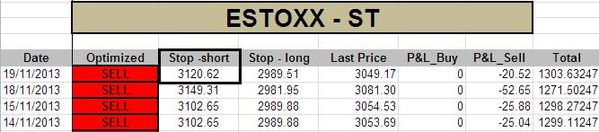
- EStoxx: short at 3027.17 (stop @ 3105, 5pts above the ST model to take into account bid/ask spread)
Medium Term Trading Book:
- No more medium term position at this stage.