31 août 2012
5
31
/08
/août
/2012
07:46
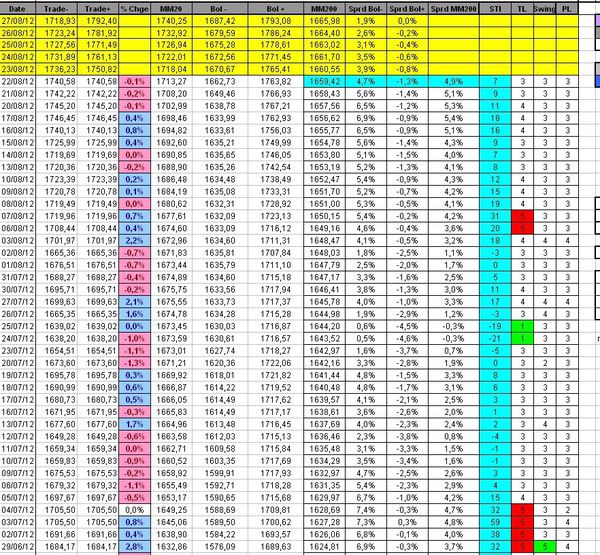
The STI turned sharply down, moving from '3' to '-15'.
The Trend Level (TL) moved from '3' (neutral) to '2' (negative)

Conclusion:
We continue to expect more short term weakness.
Short Term positions:
- short 1/2 SPX at 1413.88 (SL at 1425)
- short 1 CAC at 3495.67 (SL at 3525)
- short 1 NDX at 2770.60 (SL at 2805)
Medium term positions:
- short 2 SPX at 1336.99
- short 1 NDX at 2578.46
- short 1.5 CAC at 3103.87
Published by sigmatradingoscillator
-
dans
Market Analysis
30 août 2012
4
30
/08
/août
/2012
09:09
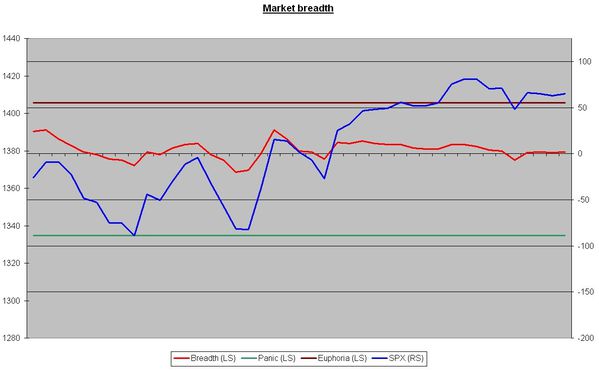
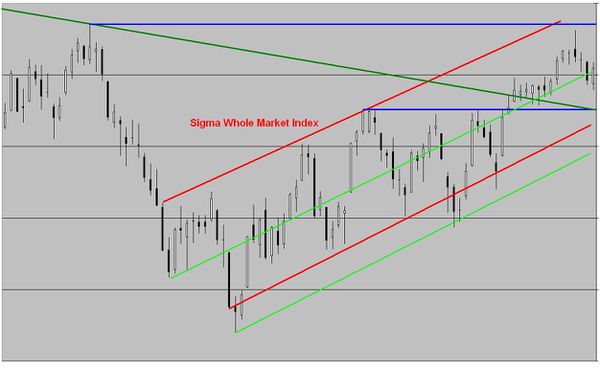
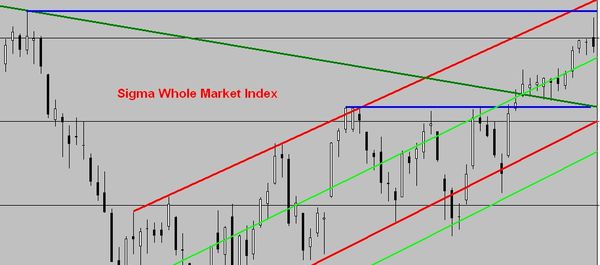
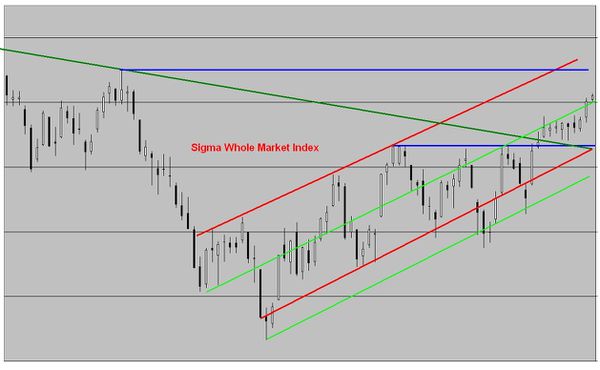
The Sigma Whole Market Index remains within its uptrend and continues to consolidate recent gains.
Nevertheless, as long as recent top holds on, we will consider this top as a possible double top.

The Sigma Trend Index (STI) is unchanged at '3'. Other indicators are neutral at '3'.

The negative divergence remains in place on the Breadth Index but this index is just above the zero line (would like to see it below zero):
Conclusion:
We don't have any new information from our indicators: the uptrend is still alive but it is very weak (5 consecutive days with a STI below '5'). We continue to expect more downside on the short term.
Short Term positions:
- short 1/2 SPX at 1413.88 (SL at 1425)
- short 1 CAC at 3495.67 (SL at 3525)
- short 1 NDX at 2770.60 (SL at 2805)
Medium term positions:
- short 2 SPX at 1336.99
- short 1 NDX at 2578.46
- short 1.5 CAC at 3103.87
Published by sigmatradingoscillator
-
dans
Market Analysis
28 août 2012
2
28
/08
/août
/2012
09:19
I have a problem with the Wi-Fi connection in the hotel. I'm unable to update the models.
I will fix this problem by Wednesday (next update).
Published by sigmatradingoscillator
-
dans
Market Analysis
27 août 2012
1
27
/08
/août
/2012
01:04
On Friday, after a weak open, the market bounced back and closed near the highest level of the day.
On an intraday basis, the lowest point of the session was achieved while the market was testing the zero line of the Sigma Trend Index.
It seems that the market refuses to slide in a downtrend.
The Sigma Trend Index is at '4', other indicators are neutral (at '3').

After one day in negative territory, the Breadth Index bounced back and closed at '1'.
Nevertheless, the negative divergence remains in place

Conclusion:
We believe we are still in a top building phase. Nevertheless, it is still unclear if last week top was THE major top.
As long as our indicators remain in positive territory, higher levels are achievable.
It is important to keep the negative divergence between the Breadth Index and prices. If this negative divergence disappears, the top building assumption will be in trouble (on a short term basis).
Short Term positions:
- short 1/2 SPX at 1413.88 (SL at 1425)
- short 1 CAC at 3495.67 (SL at 3525)
- short 1 NDX at 2770.60 (SL at 2805)
Medium term positions:
- short 2 SPX at 1336.99
- short 1 NDX at 2578.46
- short 1.5 CAC at 3103.87
Published by sigmatradingoscillator
-
dans
Market Analysis
24 août 2012
5
24
/08
/août
/2012
09:30
A short update this morning in order to show you the updated chart of the Breadth Index. You can notice that the Breadth Index turned negative on Thrusaday.
The Sigma Trend Index remains in positive territory at '2'
Published by sigmatradingoscillator
-
dans
Market Analysis
23 août 2012
4
23
/08
/août
/2012
01:47
Following Wednesday's session, we can notice that the market achieved a "doji" (once again).
So, there is a lot of uncertainty around today's price action: reversal or not?
We can notice that the Sigma trend Index (STI) continues to weaken (from '9' to '7'), telling us the uptrend is weakening. Nevertheless, we are still well above the zero line. Other indicators are in neutral territory, at '3'
Conclusion:
Following Wednesday's "doji", we believe the correction should not be over, but there is no confirmation of this situation from our indicators: it is too early to say if current move is a pullback within an uptrend or the beginning of a correction.
Short Term positions:
- short 1/2 SPX at 1413.88
- short 1 CAC at 3495.67
- short 1 NDX at 2770.60
Medium term positions:
- short 2 SPX at 1336.99
- short 1 NDX at 2578.46
- short 1.5 CAC at 3103.87
Published by sigmatradingoscillator
-
dans
Market Analysis
22 août 2012
3
22
/08
/août
/2012
07:47
Tuesday's top was pretty close to our horizontal blue resistance. On top of that, we got a meaningful reversal day, telling us we are probably ready for (at least) a correction.
In this context, we decided to open 3 new short term short positions (before US close):
Short Term positions:
- short 1/2 SPX at 1413.88
- short 1 CAC at 3495.67
- short 1 NDX at 2770.60
Published by sigmatradingoscillator
-
dans
Trade
21 août 2012
2
21
/08
/août
/2012
16:42
We close our short term long positions:
- 1NDX at 2801.51 (2801.51- 2784.18 = 17.33 (gains))
- 1CAC at 3521.79 (3521.79 - 3505.23 = 16.56 (gains))
We believe a short term term top is for this week
Published by sigmatradingoscillator
-
dans
Trade
20 août 2012
1
20
/08
/août
/2012
23:12
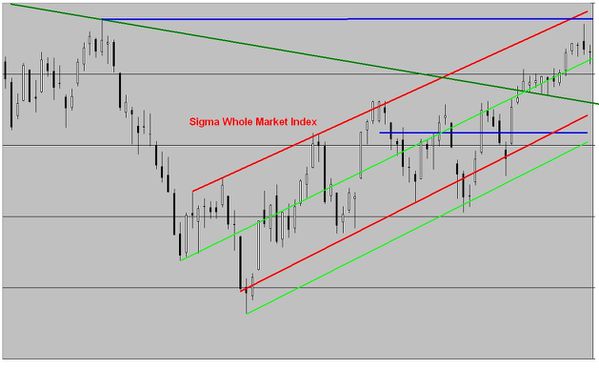
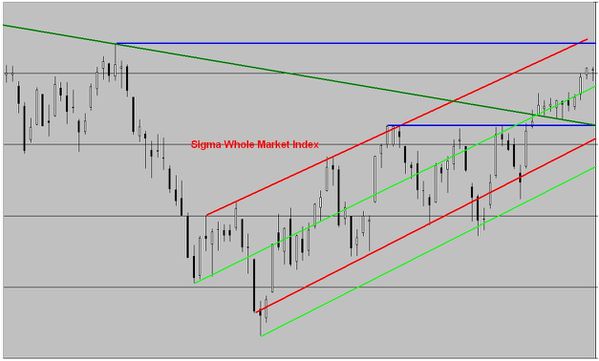
Looking at the Sigma Whole Market Index, we can notice that the market closed at the top of the day.
Today's trading session looks like a reversal day. In this context, we expect higher prices in the near future.
Nevertheless, some resistance are close to current price (~=1% to 2% above current price), so we don't expect a sharp rally from current price
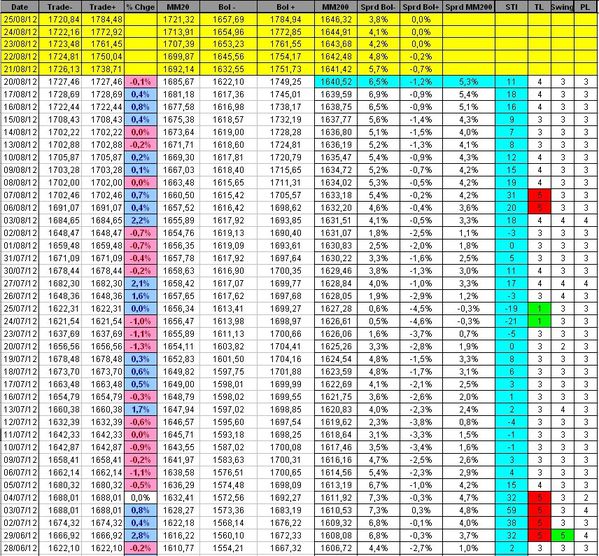
Looking at the Sigma trend Index, we can notice that this indicator declined on Monday, moving from '18' to '11'.
The Trend Level(TL) remains at '4', telling us the uptrend is still alive.
Other indicators are neutral at '3'.
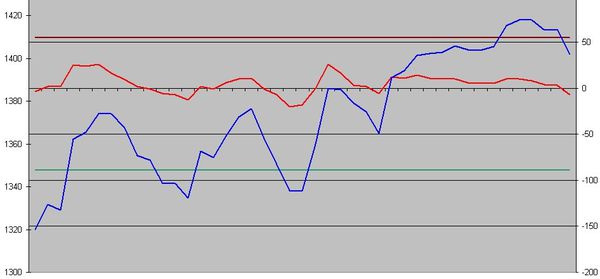
Looking at the Breadth Index, we can notice that the negative divergence is still present. This tells us we are probably building a top.

Conclusion:
We continue to believe we are building a top, but we don't believe this top is in place.
In this context, we decided to close our short term short position on the SPX at 1415.42 (vs open at 1415.88 => breakeven).
We expect a reversal later this week. (~=1% to 2% above current price)
Medium term positions:
- short 2 SPX at 1336.99
- short 1 NDX at 2578.46
- short 1.5 CAC at 3103.87
Short term positions:
- long 1NDX at 2784.18 (take profit at 2805)
- long 1CAC at 3505.23 (take profit at 3528.5)
Published by sigmatradingoscillator
-
dans
Market Analysis
19 août 2012
7
19
/08
/août
/2012
22:32
Following Friday's session, the market continues to evolve within its uptrend.
Looking at the Sigma Whole Market Index, there is no sign of reversal. Based on this chart (below), it seems obvious we will retest the horizontal blue line or the upper limit of the red uptrend channel. (~1.5 to 2% above current price)
Looking at the Sigma Trend Index (STI) the situation is unchanged at '16'.
The Trend Level (TL) is at '4' telling us we are in an uptrend without overheating.
Other indicators are at '3' (neutral)

Conclusion:
There is no sign of reversal for the time being, so we wouldn't be surprised to see higher prices in coming days.
Last week, we shorted 1 SPX at 1415.88. This position was based on a possible double top around 1422.
At this time, we don't feel comfortable with this position. So we move our stop loss to 1423 (from 1430).
We believe that a scenario similar to the one from 2007 is possible: in October 2007, the final top (prior to the huge decline) was 2% above July's high. So, we wouldn't be surprised to see the SPX moving to 1450-1460 in a massive short squeeze in order to set a major top.
Medium term positions:
- short 2 SPX at 1336.99
- short 1 NDX at 2578.46
- short 1.5 CAC at 3103.87
Short term positions:
- short 1SPX at 1415.88 (stop loss 1423)
Pending orders:
- stop buy 1NDX at 2784 (if executed, take profit at 2805)
- stop buy 1CAC at 3505 (if executed, take profit at 3530)
Published by sigmatradingoscillator
-
dans
Market Analysis


