Overblog
Suivre ce blog Administration + Créer mon blog
22 septembre 2013 7 22 /09 /septembre /2013 09:41

We flashed on Thursday that the market was right at the top of the uptrend and that we would be we very surprised if the market was able to move above this key resistance without any pullback. Indeed, we got a meaningful decline on Friday but it is way to early to claim the market started a correction phase.


usmarket20130920.JPG


Both the Swing and the power Level was at '2' on Friday, telling us the decline was impulsive. That's a good start when we are short...


stmodel20130920.JPG


The ST model lowered its stops on some indexes:


stspx20130920.JPG

stndx20130920.JPG

stestox20130920.JPG


Short Term Trading Book:


- SPX: 1 short at 1722.12 (stop @ 1760, 3pts above the ST model to take into account bid/ask spread)

- NDX: 1 short at 3173.42 (stop @ 3324, 5pts above the ST model to take into account bid/ask spread)

- CAC: 1 short at 4104.63 (stop @ 4400, 5pts above the ST model to take into account bid/ask spread)

- DAX: 1 short at 8682.24 (stop @ 8936, 10pts above ST model to take into account bid/ask spread)

- EStoxx: 1 short at 2931.37 (stop @ 3001, 5pts above the ST model to take into account bid/ask spread)


Medium Term Trading Book:


- No more medium term position at this stage.

Partager cet article
Repost0
20 septembre 2013 5 20 /09 /septembre /2013 07:34

The market remains at the upper end of the (red) uptrend but it seems that current level acts as a strong resistance:


usmarket20130919.JPG


Looking at our indicators, the Power Level declined to '2' on Thursday. As we had a Sigma Trend Index at '61' on Wednesday (well above the key '34' level), we got a fresh confirmed sell signal on Thursday's close. (have a look at our methodology if you want more details on our signals, link in right column)


stmodel20130919.JPG


As we got a fresh sell signal, the ST model computed new stop levels for all our positions. We agree it can be percreived as a weakness of the model but it is the way the ST model has been built: stop levels are (re)computed on each new signal.


stspx20130919.JPG

stndx20130919.JPG

stcac20130919.JPG

stdax20130919.JPG

stestox20130919.JPG


So, according to our model, we opened new short positions (on US close):

- 1 SPX at 1722.12

- 1 DAX at 8682.24

- 1 EStoxx at 2931.37


Short Term Trading Book:


- SPX: 1 short at 1722.12 (stop @ 1768, 3pts above the ST model to take into account bid/ask spread)

- NDX: 1 short at 3173.42 (stop @ 3340, 5pts above the ST model to take into account bid/ask spread)

- CAC: 1 short at 4104.63 (stop @ 4400, 5pts above the ST model to take into account bid/ask spread)

- DAX: 1 short at 8682.24 (stop @ 8936, 10pts above ST model to take into account bid/ask spread)

- EStoxx: 1 short at 2931.37 (stop @ 3015, 5pts above the ST model to take into account bid/ask spread)


Medium Term Trading Book:


- No more medium term position at this stage.

Partager cet article
Repost0
19 septembre 2013 4 19 /09 /septembre /2013 07:49

Following the 'No taper' news, the market surged and we are now at the top end of the red uptrend. Can we break up this channel? It seems difficult but in current 'easy money' policy, everything remains possibly...

usmarket20130918.JPG


There is no more divergence between the Sigma Trend Index and the Sigma Whole Market Index (both printed new highs):


STI20130918.JPG


The Sigma Trend Index surged to '61' which means we could get a fresh sell signal if the Swing or the Power Level declines below '3' in the next 3 sessions:


stmodel20130918.JPG


Some stops were triggered during the US session:

- 2 MT contracts  on the SPX: stopped at 1724.13 => (1682.84 - 1724.13) x 2 = -82.58 (loss)

- 1 ST contract on the SPX stopped at 1729.17 => 1682.69 - 1729.17 = -46.48 (loss)

- 1 ST contract on the DAX stopped at 8689.32 => 8485.55 - 8689.22 = -203.67 (loss)

- 1 ST contract on the Estoxx stopped at 2928.87 => 2856.5 - 2928.87 = -72.37 (loss)


Short Term Trading Book:


- NDX: 1 short at 3173.42 (stop @ 3260, 5pts above the ST model to take into account bid/ask spread)

- CAC: 1 short at 4104.63 (stop @ 4296, 5pts above the ST model to take into account bid/ask spread)


Medium Term Trading Book:


- no more position

Partager cet article
Repost0
18 septembre 2013 3 18 /09 /septembre /2013 07:08

There is no big change at this stage. The negative divergence between the Sigma Trend Index and the Sigma Whole Market Index remains under construction. This tells us that the underlying uptrend has been weakening in recent days.


STI20130917.JPG


There is no change in our trading books.

Short Term Trading Book:


- SPX: 1 short at 1682.69 (stop @ 1729, 3pts above the ST model to take into account bid/ask spread)

- NDX: 1 short at 3173.42 (stop @ 3260, 5pts above the ST model to take into account bid/ask spread)

- CAC: 1 short at 4104.63 (stop @ 4296, 5pts above the ST model to take into account bid/ask spread)

- DAX: 1 short at 8485.55 (stop @ 8688, 10pts above ST model to take into account bid/ask spread)

- EStoxx: 1 short at 2856.50 (stop @ 2926, 5pts above the ST model to take into account bid/ask spread)


Medium Term Trading Book:


- SPX: 2 shorts at 1682.84 (stop @ 1724, 3pts above the MT model to take into account bid/ask spread)

Partager cet article
Repost0
17 septembre 2013 2 17 /09 /septembre /2013 07:30

The Sigma Whole market Index (aggregate of 16 US indexes) reversed at its 52weeks high, printing what could be a double top. On top of that, yesterday's candle structure looks like a reversal day:


usmarket20130916.JPG


When we look at the Sigma Trend Index, we can notice a negative divergence (under construction) between the Sigma Trend Index and the Sigma Whole Market Index (to be confirmed in coming days). This is another 'warning signal' that a market top could be just around the corner.


STI20130916.JPG


The ST model lowered its stops for some positions:


stndx20130916.JPG

stdax20130916.JPG

stestox20130916.JPG


Short Term Trading Book:


- SPX: 1 short at 1682.69 (stop @ 1729, 3pts above the ST model to take into account bid/ask spread)

- NDX: 1 short at 3173.42 (stop @ 3260, 5pts above the ST model to take into account bid/ask spread)

- CAC: 1 short at 4104.63 (stop @ 4296, 5pts above the ST model to take into account bid/ask spread)

- DAX: 1 short at 8485.55 (stop @ 8688, 10pts above ST model to take into account bid/ask spread)

- EStoxx: 1 short at 2856.50 (stop @ 2926, 5pts above the ST model to take into account bid/ask spread)


Medium Term Trading Book:


- SPX: 2 shorts at 1682.84 (stop @ 1724, 3pts above the MT model to take into account bid/ask spread)

Partager cet article
Repost0
13 septembre 2013 5 13 /09 /septembre /2013 07:32

The Power Level closed at '2' on Thursday. So, the sell signal has been confirmed (if you want more details on 'buy' and 'sell' signal, have a look at our methodology by clicking on the link in the right column)


stmodel20130912.JPG


So, we closed our 2 remaining long positions and we opened new short positions (on CFDs) at US market close:


- SPX: 1682.69 - 1654.12 = 28.57 pts (gains)

- NDX: 3173.42 - 2868.55 = 304.87 pts (gains)


The ST model computed its stop levels for the new (short) positions:


stspx20130912.JPG

stndx20130912.JPG

stcac20130912.JPG

stdax20130912.JPG

stestox20130912.JPG


Short Term Trading Book:


- SPX: 1 short at 1682.69 (stop @ 1729, 3pts above the ST model to take into account bid/ask spread)

- NDX: 1 short at 3173.42 (stop @ 3276, 5pts above the ST model to take into account bid/ask spread)

- CAC: 1 short at 4104.63 (stop @ 4296, 5pts above the ST model to take into account bid/ask spread)

- DAX: 1 short at 8485.55 (stop @ 8731, 10pts above ST model to take into account bid/ask spread)

- EStoxx: 1 short at 2856.50 (stop @ 2940, 5pts above the ST model to take into account bid/ask spread)


Medium Term Trading Book:


- SPX: 2 shorts at 1682.84 (stop @ 1724, 3pts above the MT model to take into account bid/ask spread)

Partager cet article
Repost0
12 septembre 2013 4 12 /09 /septembre /2013 07:31

Our ST model has been in 'buy' mode since early June. With the Sigma Trend Index (STI) at 41 (clearly above the key 34 level), the first required condition for a short position is in place. Now, we need either the Swing or the Power Level to decline below '3' within the next 3 sessions on order to activate the 'sell' signal. (if you want more details, have a look at our methodology by clicking on the link in the right column).


stmodel20130911.JPG


The ST model uplifted its stop on the SPX:


stspx20130911.JPG


Short Term Trading Book:


- SPX: 1 long at 1654.12 (stop @ 1623, 3pts below the ST model to take into account bid/ask spread)

- NDX: 1 long at 2868.65 (stop @ 3016, 5pts below the ST model to take into account bid/ask spread)


Medium Term Trading Book:


- SPX: 2 shorts at 1682.84 (stop @ 1724, 3pts above the MT model to take into account bid/ask spread)

Partager cet article
Repost0
11 septembre 2013 3 11 /09 /septembre /2013 08:57

Tuesday's session was very interesting because the Sigma Whole Market Index created a gap (up) at market open.

So, we can clearly see that recent weakness started with a gap down and ended (so far) with a gap up. This pattern is called an 'island' and this is rather bullish when it occured during a correction.


usmarket20130910.JPG


The Sigma Trend Index closed at '32' which is very close to the key '34' level required for a sell signal. The Swing closed at '4' for the second consecutive session, telling us that Tuesday's session was impulsive.


stmodel20130910.JPG


The ST model upliftged its stops:


stndx20130910.JPG

stspx20130910.JPG


Short Term Trading Book:


- SPX: 1 long at 1654.12 (stop @ 1621, 3pts below the ST model to take into account bid/ask spread)

- NDX: 1 long at 2868.65 (stop @ 3016, 5pts below the ST model to take into account bid/ask spread)


Medium Term Trading Book:


- SPX: 2 shorts at 1682.84 (stop @ 1724, 3pts above the MT model to take into account bid/ask spread)

Partager cet article
Repost0
10 septembre 2013 2 10 /09 /septembre /2013 05:30

The Sigma Trend Index closed just below the strong horizontal resistance (pink line). We consider the rebound is rather mature so if the correction isn't over, the market should roll down very soon.


usmarket20130909.JPG


The Sigma Trend Index continues to improve and we are now well in positive territory (at '11'). Bears are losing their grip on the market.


stmodel20130909.JPG


The ST model uplifted its stop on both the NDX and the SPX:


stspx20130909.JPG

stndx20130909.JPG


Short Term Trading Book:


- SPX: 1 long at 1654.12 (stop @ 1615, 3pts below the ST model to take into account bid/ask spread)

- NDX: 1 long at 2868.65 (stop @ 3011, 5pts below the ST model to take into account bid/ask spread)


Medium Term Trading Book:


- SPX: 2 shorts at 1682.84 (stop @ 1724, 3pts above the MT model to take into account bid/ask spread)

Partager cet article
Repost0
7 septembre 2013 6 07 /09 /septembre /2013 11:06

Short Term(ST)


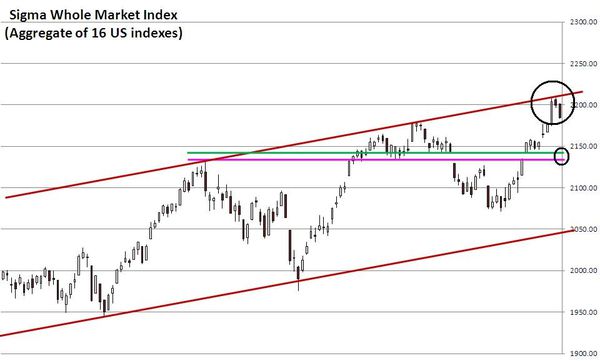
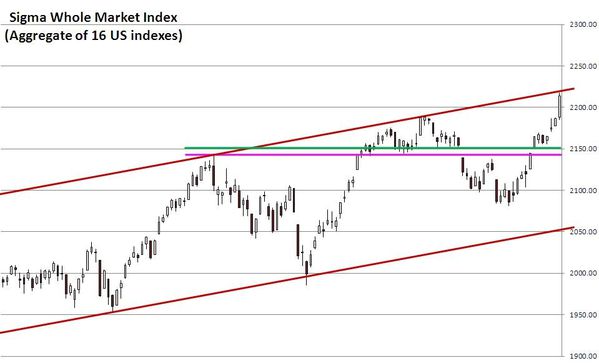
When we look at the chart of the Sigma Whole Market Index (aggregate of 16 US indexes), we can notice recent rebound represents 50% of last month's decline. On top of that, the strong pink horizontal resistance is not far from current levels.

We don't consider it is easy to count last decline: is it a 5waves decline (1,2,3,4,5) or a 3 waves decline (a,b,c with c in 5 subwaves)?

A 5 waves decline would mean the start of a downtrend/correction while a 3 waves decline would mean a pullback in an uptrend.


In this context, it will be very important to see if the market can move above the pink horizontal level. If it can, recent decline was probably a pullback in an uptrend. But if the market reverses next week from current levels, we could have a nasty sell off.


usmarket20130906.JPG


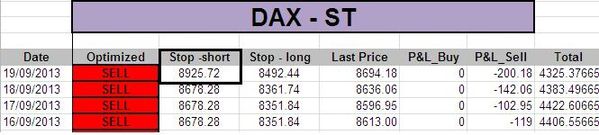
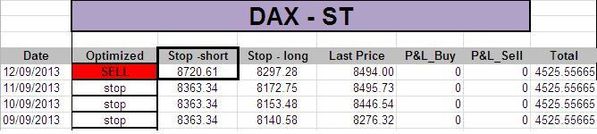
When we look at the chart of the DAX, we can notice the recent rebound is very modest, and we are actually testing the broken uptrend channel by the south. If we can't move above this level next week, this will be bearish.

Nevertheless, looking at the DAX, it seems that last decline was a 3 waves move => slightly in favor of a pullback rather than the start of a decline


chartdax20130906.JPG

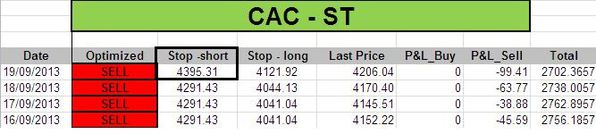
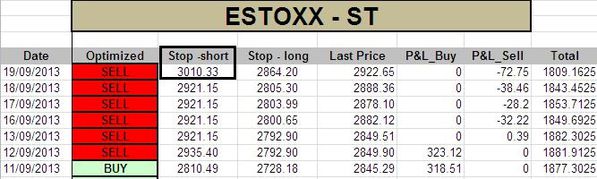
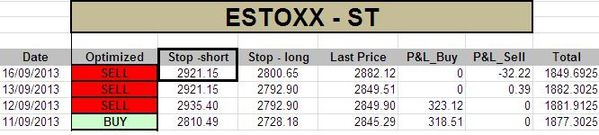
When we look at the chart of the CAC and the EuroStoxx50, we can notice that recent rebounds were the strongest ones(relative to other indexes)with a 61.8% retracement of last decline. We consider it is due to an outperformance of European financials (heavily weighted in both the CAC and the EuroStoxx) vs the rest of the market.


As a 61.8% retracement is an important pullback, those indexes are the ones to focus on early next week. If they can continue to advance from current levels, there is a good probability that recent decline was just a pullback in an uptrend.


chartcac20130906.JPG

chartestox20130906.JPG


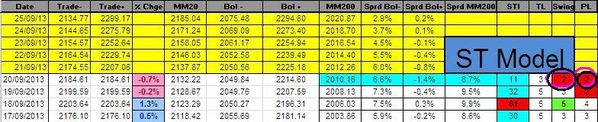
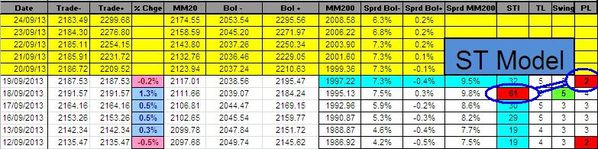
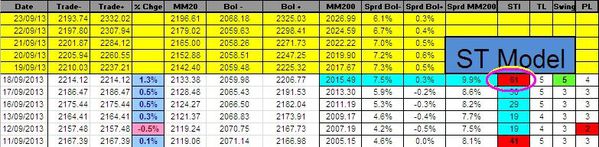
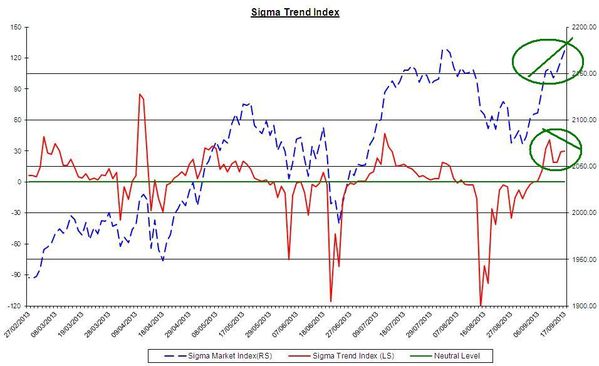
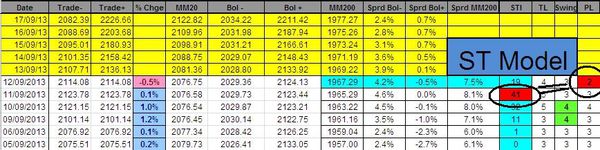
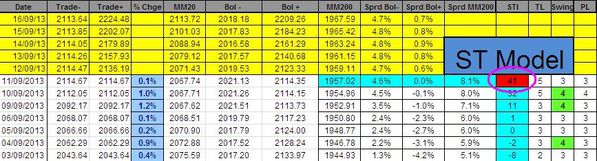
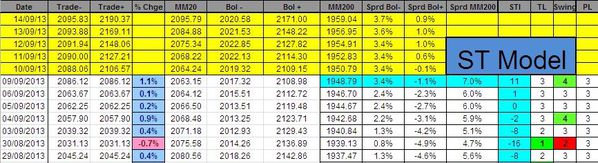
The Sigma Trend Index(STI) was able to close in positive territory on Friday (at '1'), telling us we are in a weak positive uptrend.


stmodel20130906.JPG


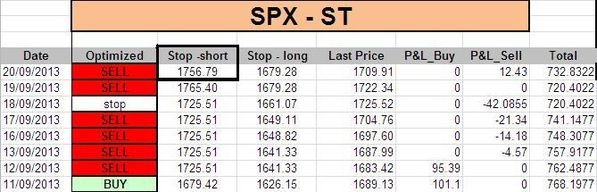
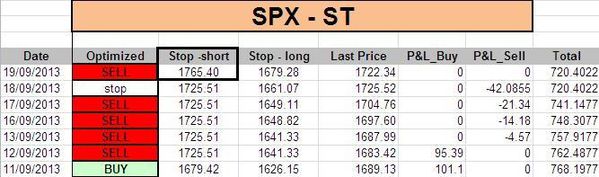
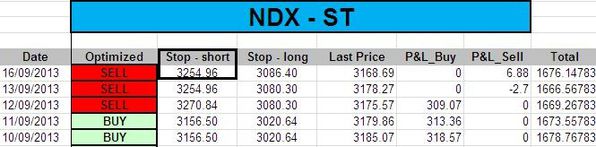
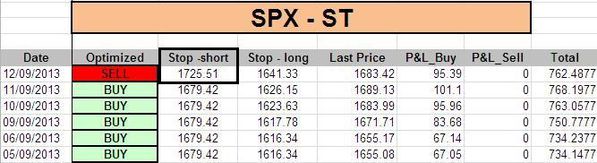
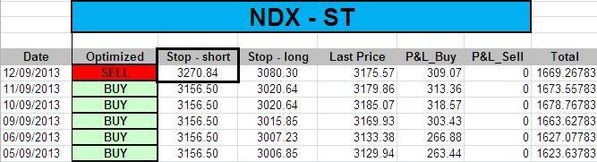
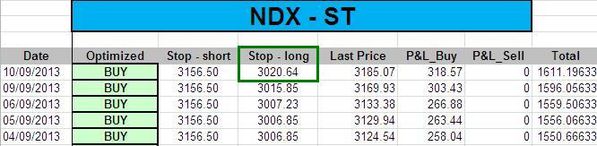
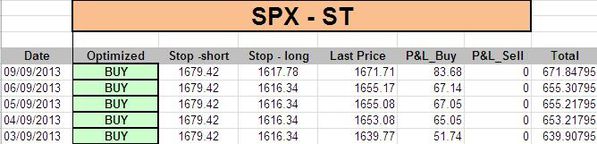
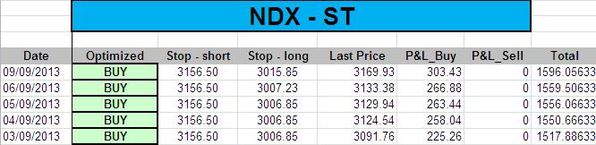
The ST model uplifted its stop level on the NDX and left it unchanged on the SPX. We don't have anymore position in Europe because our stops were hit during recent decline (and we booked strong gains).


stndx20130906.JPG

stspx20130906.JPG


Medium Term:(MT)


We can notice the Sigma Whole Market Index remains below its 50days MA (red line).

We had a similar situation twice in the past (boxes A and B). In box A we got a nasty sell off after a retest of the 50d MA (by the south) while in box B the market was able to restore its uptrend.

It is difficult to say which pattern will be followed this time but as long as we have an upward 50d MA, current situation looks more like the B box. But if the 50d MA starts to flatten, the situation could deteriorate very quickly.


SWM20130906.JPG


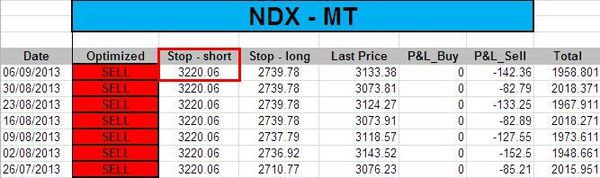
There is no change in the MT model, it is in sell mode on both the SPX and the NDX since Easter.


mtndx20130906.JPG

mtspx20130906.JPG


There is no change in our positions:


Short Term Trading Book:


- SPX: 1 long at 1654.12 (stop @ 1613, 3pts below the ST model to take into account bid/ask spread)

- NDX: 1 long at 2868.65 (stop @ 3002, 5pts below the ST model to take into account bid/ask spread)


Medium Term Trading Book:


- SPX: 2 shorts at 1682.84 (stop @ 1724, 3pts above the MT model to take into account bid/ask spread)

Partager cet article
Repost0

Presentation

  • : Le blog de sigmatradingoscillator
  • : Professionnel de la finance de marché depuis plus de 10ans, j'ai mis au point une série d'outils de trading me permettant de prendre et couper mes positions. Ici, j'écris un update quotidien sur la situation du CAC,DAX, Eurostoxx, SP500, Nasdaq100. Attention Les éléments repris dans ce blog représentent uniquement mon opinion personnelle et ne constituent en aucun cas une incitation au trading ou du conseil financier. Pour du conseil, consultez votre conseiller en placement
  • Contact

Disclaimer

NO MATERIAL HERE CONSTITUTES "INVESTMENT ADVICE" NOR IS IT A RECOMMENDATION TO BUY OR SELL ANY FINANCIAL INSTRUMENT, INCLUDING BUT NOT LIMITED TO STOCKS, COMMODITIES, OPTIONS, BONDS, FUTURES, OR BULLION. ACTIONS YOU UNDERTAKE AS A CONSEQUENCE OF OUR ANALYSIS, OPINION OR ADVERTISEMENT ON THIS SITE ARE YOUR SOLE RESPONSIBILITY.

FOR INVESTMENT ADVICE, PLAN A MEETING WITH A FINANCIAL ADVISOR IN ORDER TO ESTABLISH YOUR OWN RISK PROFILE.

Archives

Pages