6 septembre 2013
5
06
/09
/septembre
/2013
07:35
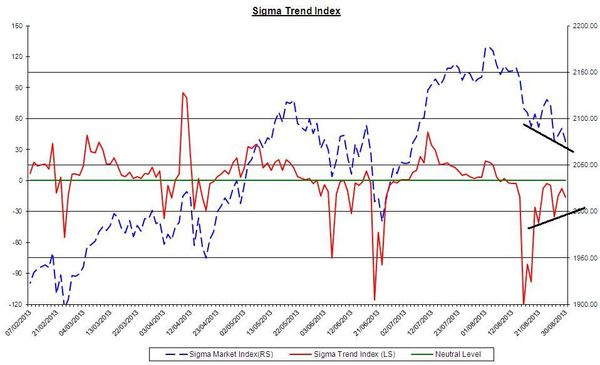
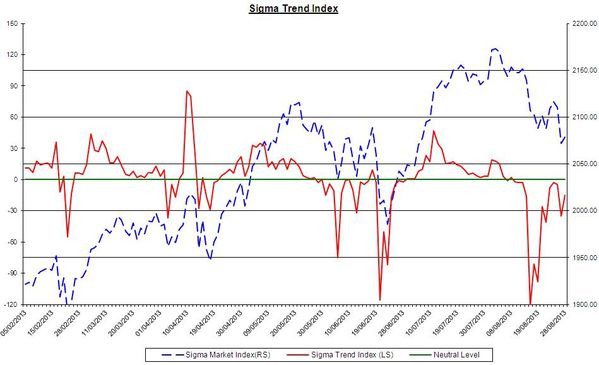
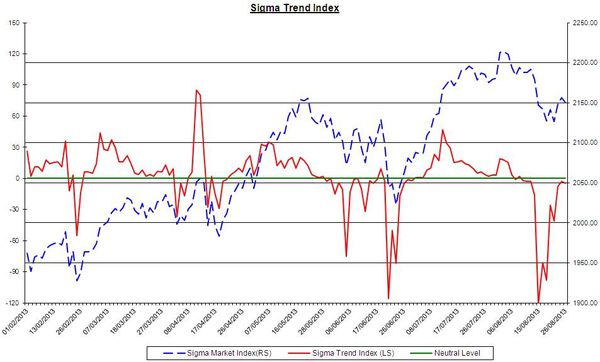
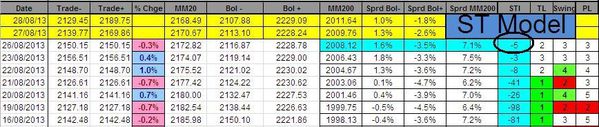
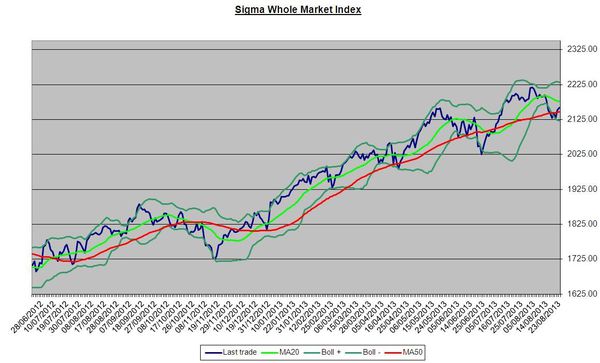
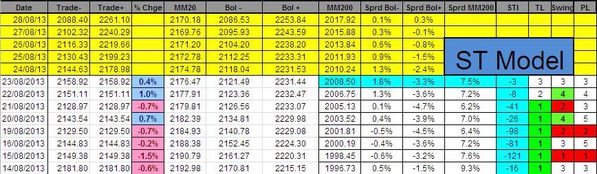
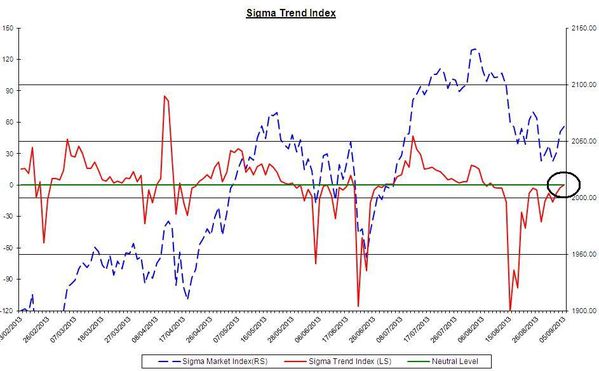
The Sigma Trend Index is currently testing its zero line. It will be highly important to monitor what happens in coming sessions.
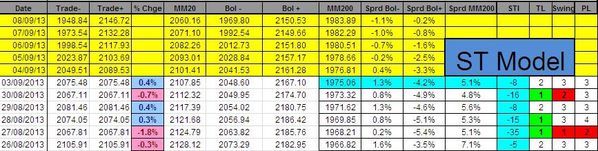
There is no change in our positions. Our stops are unchanged:
Short Term Trading Book:
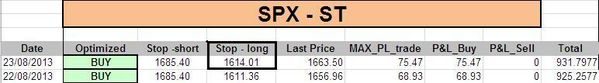
- SPX: 1 long at 1654.12 (stop @ 1613, 3pts below the ST model to take into account bid/ask spread)
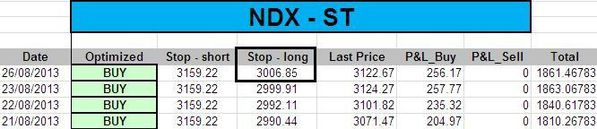
- NDX: 1 long at 2868.65 (stop @ 3002, 5pts below the ST model to take into account bid/ask spread)
Medium Term Trading Book:
- SPX: 2 shorts at 1682.84 (stop @ 1724, 3pts above the MT model to take into account bid/ask spread)
Partager cet article