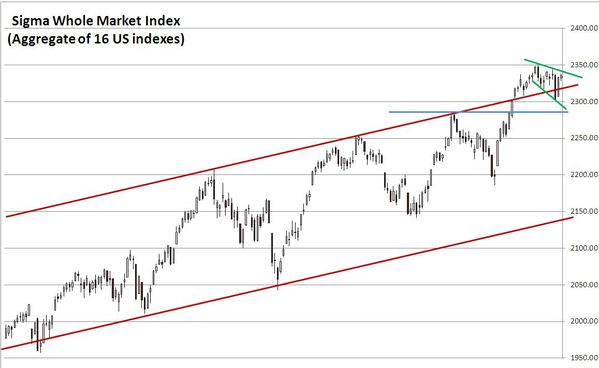
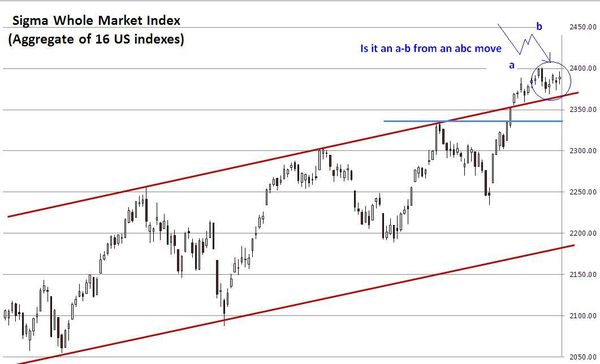
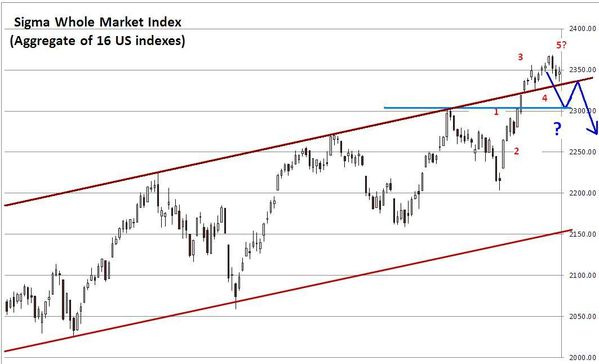
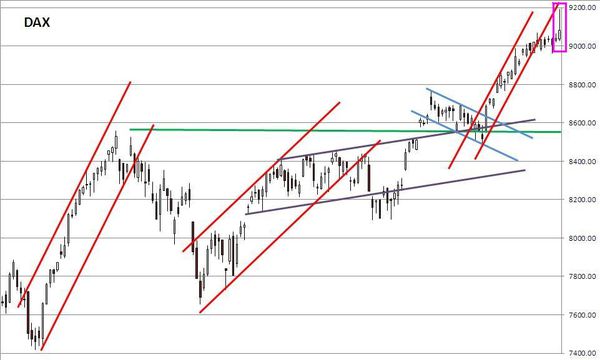
Yesterday we wrote: "...Looking at the chart, recent move looks like an a-b move from an a-b-c (or a 1-2 from a 1-2-3-4-5 move). Patience, the breakout is probably for today, and I would prefer a breakout by the south..."
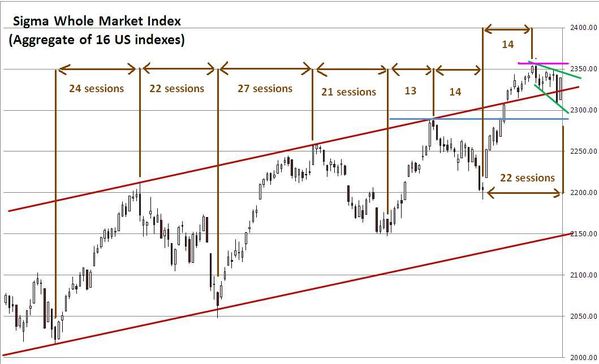
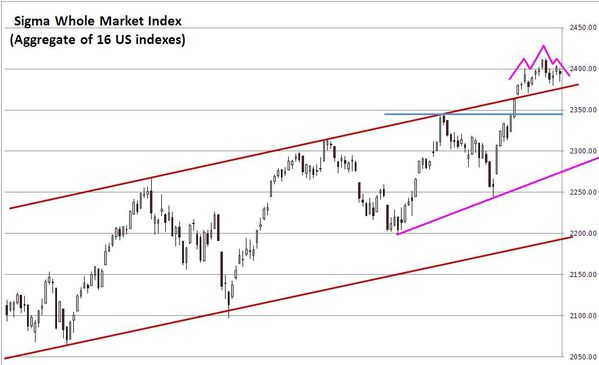
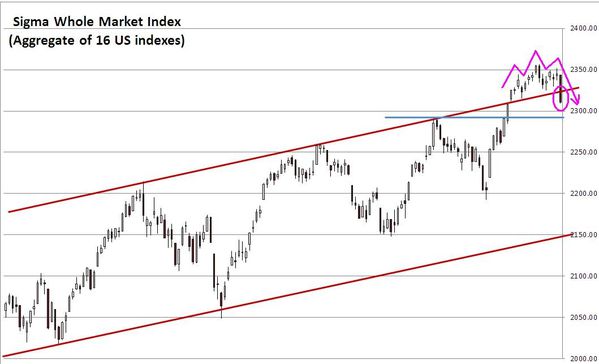
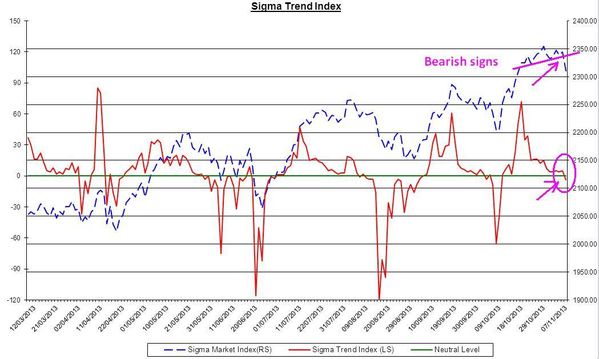
We can notice the head & shoulders we detected on the Sigma Whole Market Index was confirmed. The breakout is clear and the target (size of the head reported below the neckline) is the blue horizontal line.
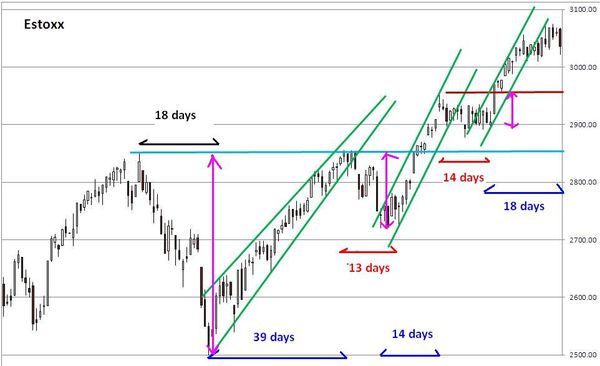
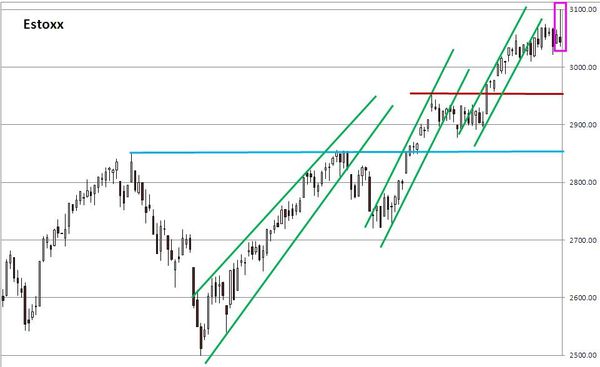
In Europe the situation is even more bearish. After a huge run up during the session (just after ECB's surprise rate cut), the market reversed from earlier gain and closed in negative territory. These kind of big reversals (of more than 2%) are highly bearish. Why? Because it means investors and traders knew they were running ahead of fundamentals and at the first signs of decline in the market, everyone is running to the exit => major reversal.
Usually this pattern (up or down) only occurs at major turnaround in the market. In this context, we expect a deep correction in Europe in coming days/weeks.

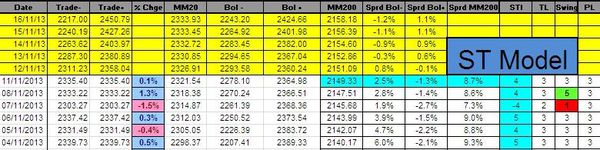
The Sigma Trend Index declined in negative territory. Once again, the negative divergence we had few sessions ago (between the Sigma Whole Market Index and the Sigma Trend Index) was an early sign of correction.
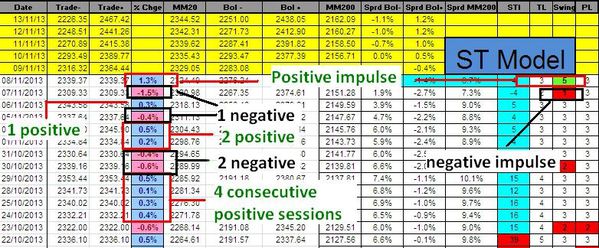
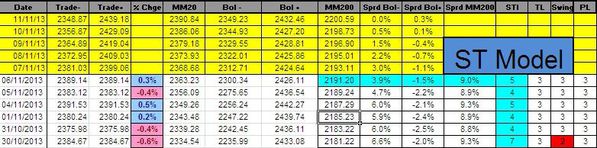
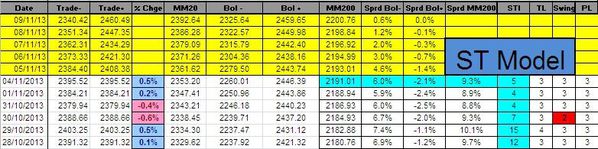
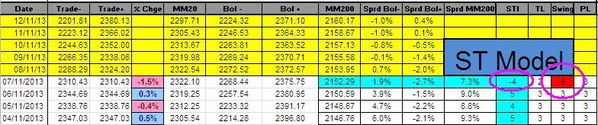
Looking at our indicators, the Sigma Trend Index declined from '5' to '-4' and the Swing collapsed to '1', telling us yesterday's move was highly impulsive.
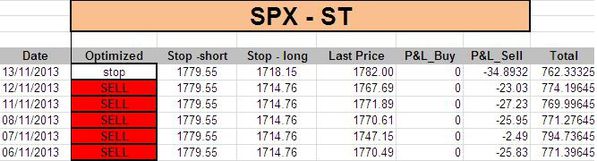
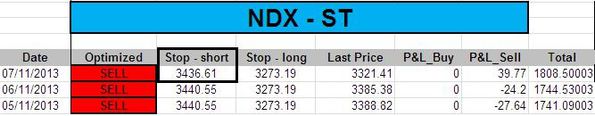
Unfortunately, the surge in the Dax reached our stop level and we closed the position. All other positions are still open, and the model computed new stop level for the NDX :

We closed our short position on the DAX @ 9102.17 => 8860.35 - 9102.17 = -241.82 (loss)
Short Term Trading Book:
- SPX: 1 short at 1742.85 (stop @ 1783, 3pts above the ST model to take into account bid/ask spread)
- NDX: 1 short at 3361.01 (stop @ 3445, 5pts above the ST model to take into account bid/ask spread)
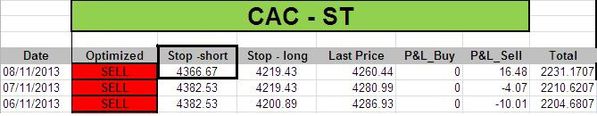
- CAC: 1 short at 4272.14 (stop @ 4400, 5pts above the ST model to take into account bid/ask spread)
- DAX: no more position
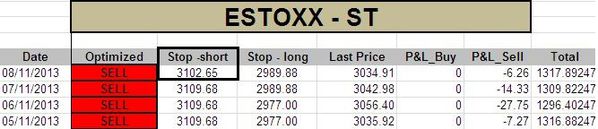
- EStoxx: 1 short at 3027.17 (stop @ 3115, 5pts above the ST model to take into account bid/ask spread)
Medium Term Trading Book:
- No more medium term position at this stage.