21 décembre 2012
5
21
/12
/décembre
/2012
09:11
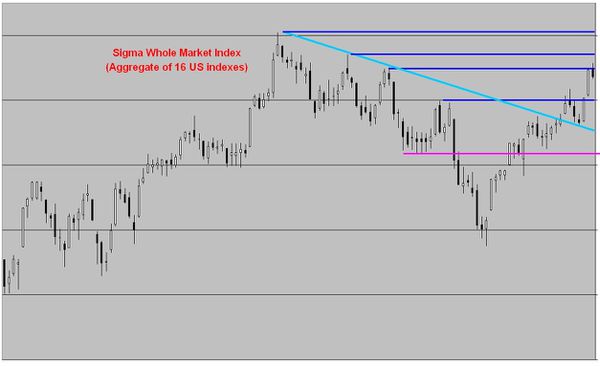
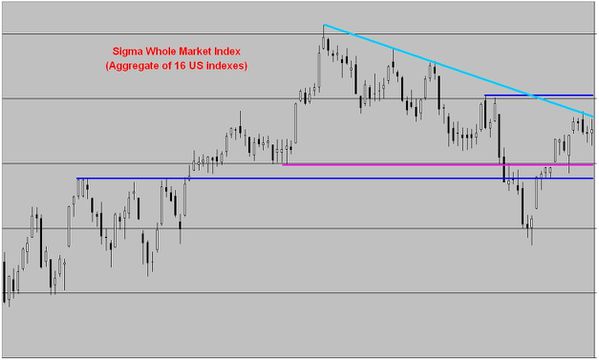
The market launched a new attempt to the upside and closed (for the second time) just below a key horizontal resistance.
It will be important to see what happen from here.
While I'm writing this daily, futures are losing 1.5% due to new comments related to the Fiscal Cliff. It sounds clear that we will have a gap down on Friday but it will be important to see if the market is able to retrace some of its early loss or if it declines further.

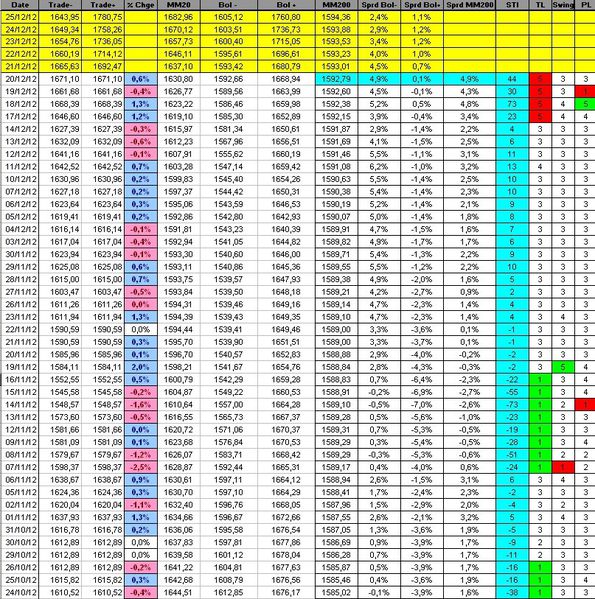
The Sigma Trend Index increased from '30' to '44' but other indicators are neutral at '3'
Conclusion:
Futures are pointing for a weak open but everything is possible because we are in a news flow driven market and in this kind of market it is very important to manage the risk exposure: anything can happen at anytime...
We keep our hedge for the time being.
Short term position:
- long 2 CAC at 3653.6
- long 2 SPX at 1434,12
Medium term positions:
- short 1.5 SPX at 1376.22
- short 1.5 CAC at 3103.87
Published by sigmatradingoscillator
-
dans
Market Analysis
20 décembre 2012
4
20
/12
/décembre
/2012
07:38
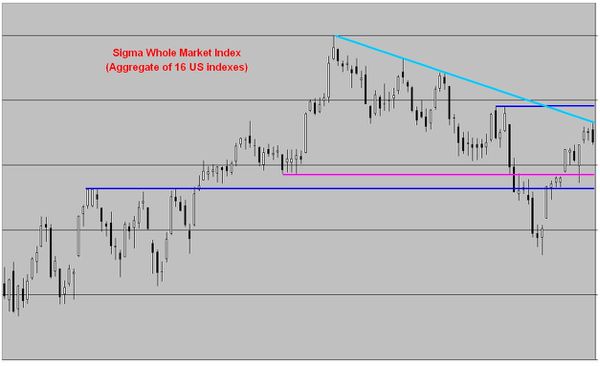
The market was unable to close above the next strong resistance and printed a kind of reversal day on Wednesday.
As we were not at "euphoria" level on Tuesday, it is too early to say if this move is a reversal or a consolidation after 2 strong sessions.
The Sigma Trend Index (STI) declined from '73' to '31'. More importantly, the power level (PL) moved from '5' (very strong) to '1' (very poor). This kind of huge swing (from '5' to '1' or from '1' to '5') usually occurs at trend reversal.
So, based on those indicators, it looks like Wednesday's prices action calls for a key reversal day.

Conclusion:
The Power Level is calling for a reversal (and a top in place). Nevertheless, as we were not at euphoria level on Tuesday, we prefer to have more evidence of this reversal before closing our short term hedge.
Short term position:
- long 2 CAC at 3653.6
- long 2 SPX at 1434,12
Medium term positions:
- short 1.5 SPX at 1376.22
- short 1.5 CAC at 3103.87
Published by sigmatradingoscillator
-
dans
Market Analysis
19 décembre 2012
3
19
/12
/décembre
/2012
08:59
The market continued its rally on Tuesday, and we are pretty happy that our short positions were hedged.
We are now close to a strong resistance. If we are able to move above this level, we will probably reach new 52 weeks highs by the end of this year.

The Sigma Trend Index jumped again on Tueday. The power level (PL) is at '5' and the swing is at '4'.

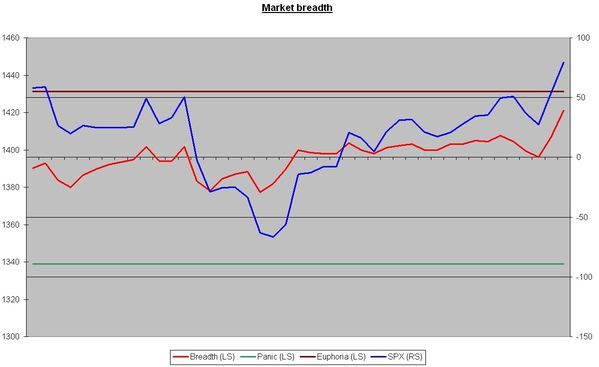
The Breadth Index (red line) is close to euphoria (horizontal brown line), but it isn't there yet.
Conclusion:
The market is in a major year end rally coupled with a massive short squeeze. We believe fireworks are on the agenda. It will be important to monitor the euphoria level during this move.
This move is very similar to the one from April.
Short term position:
- long 2 CAC at 3653.6
- long 2 SPX at 1434,12
Medium term positions:
- short 1.5 SPX at 1376.22
- short 1.5 CAC at 3103.87
Published by sigmatradingoscillator
-
dans
Market Analysis
18 décembre 2012
2
18
/12
/décembre
/2012
08:48
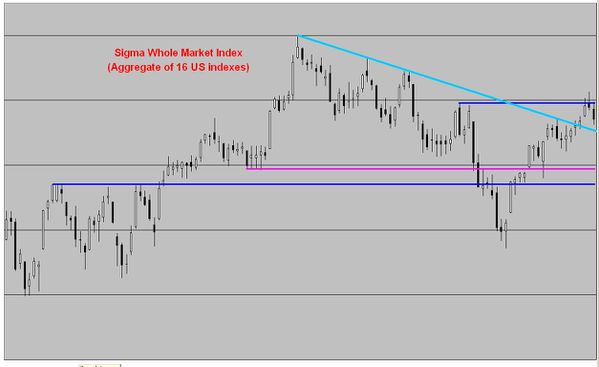
The market was able to find some support on the light blue downtrend and bounced back sharply on Monday.

The Sigma Trend Index bounced back sharply and it is important to notice that theTrend Level (TL) jumped to '5' while both the swing and the power level (PL) moved to '4'

Conclusion:
Monday's move was powerful and we don't want to go against it.
We will close our short term short positions and hedge all our medium term short postions by taking some short term long positions.
Short term position:
- short 2 NDX at 2673.8
Medium term positions:
- short 1.5 SPX at 1376.22
- short 1.5 CAC at 3103.87
Published by sigmatradingoscillator
-
dans
Market Analysis
17 décembre 2012
1
17
/12
/décembre
/2012
09:07
The market continued its pullback on Friday and tested the light blue downtrend by the north. It will be important to see if the market is able to find some support here or if it goes through this support.

The Sigma Trend Index eased again on Friday but it remains in positive territory. Other indicators remains neutral at '3'.

Conclusion:
The consolidation could be over at this level, but we would prefer to see a test of the Sigma Trend Index's zero line. We keep our positions unchanged for the time being.
Short term position:
- short 2 NDX at 2673.8
Medium term positions:
- short 1.5 SPX at 1376.22
- short 1.5 CAC at 3103.87
Published by sigmatradingoscillator
-
dans
Market Analysis
14 décembre 2012
5
14
/12
/décembre
/2012
08:48
After wednesday's reversal, the market pursued its pullback on thursday. We are now pretty close to the light blue downtrend that we will probably test by the north on friday.
If we find some support there, we could get a rebound leading to a marginal high in coming days but we remain short term bearish for the time being.
The Sigma Trend Index (STI) declined to '6', other indicator are at '3' (neutral)

Conclusion:
After wednesday's reversal, the market is now in a consolidation/pullback mode. Level at which the market will find support and the "violence" of the next bounce back will be very important to monitor.
Short term position:
- short 2 NDX at 2673.8
Medium term positions:
- short 1.5 SPX at 1376.22
- short 1.5 CAC at 3103.87
Published by sigmatradingoscillator
-
dans
Market Analysis
13 décembre 2012
4
13
/12
/décembre
/2012
01:18
As explained in our previous messages, the next obvious level to test (after the break of the light blue downtrend) was the dark blue horizontal line.
The market broke this level on both Tuesday and Wednesday (intraday) but wasn't able to close above it.
But Wednesday's price action was very interesting because the market closed around the low of the day and printed a "hammer". When printed after a meaningful rally, this figure usually signals a reversal.

The Sigma Trend Index (STI) is at '9' and other indicators are neutral at '3'

Conclusion:
It seems the market printed a key reversal figure on Wednesday ("hammer"). We believe the market should test the pink horizontal line in coming days (roughly at the same level as the STI's zero line)
Medium term positions:
- short 1.5 SPX at 1376.22
- short 1.5 CAC at 3103.87
Published by sigmatradingoscillator
-
dans
Market Analysis
10 décembre 2012
1
10
/12
/décembre
/2012
05:54
The market remains below the light blue downtrend and has been in consolidation mode for more than one week.
If we are able to move above this level, the next target is the dark blue horizontal line.

The Sigma Trend Index is at '10'. Other indicators are at '3' (neutral)

Conclusion:
The market is in consolidation for more than one week, the pullback was pretty shy but thanks to the duration (10days), the consolidation could be over, and the market could resume its uptrend.
Nevertheless, as long as the market remains below the light blue downtrend, we remain in favor of further consolidation.
Short term position:
- short 1 CAC at 3567.17
- short 1 NDX at 2655.07
Medium term positions:
- short 1.5 SPX at 1376.22
- short 1.5 CAC at 3103.87
Published by sigmatradingoscillator
-
dans
Market Analysis
6 décembre 2012
4
06
/12
/décembre
/2012
07:22
Wednesday was a volatile session and the market was able to reach both higher low and lower low (relative to Tuesday) and printed a 'doji' for the session. The market tested the light blue downtrend but wasn't able to break it.
As long as the light blue downtrend resists, the bears have the control of the market. If the market is able to move above this downtrend, the next 'obvious' level will be the horizontal dark blue line.
The Sigma Trend Index remains in positive territory and other indicators are neutral.

The Breadth index continues to improve (red line), this is something we have to monitor because this can signal the rebound isn't over. So, current move would only be a pullback/consolidation of recent advance.

Conclusion:
We believe current pullback is probably a consolidation.
It is also interesting to notice that most European indexes are very very strong (probably some flows back from US into EU), they are reaching new highs days after days. This is another point in favor of futher advance.
In this context, we are ready to close our short term short positions, but we believe lower levels are achievable. Mainly on the NDX (2600 area) where its 'star' and biggest weight (Apple) is in big trouble (its chart is awful).
Short term position:
- short 1 CAC at 3567.17
- short 1 NDX at 2655.07
Medium term positions:
- short 1.5 SPX at 1376.22
- short 1.5 CAC at 3103.87
Published by sigmatradingoscillator
-
dans
Market Analysis
4 décembre 2012
2
04
/12
/décembre
/2012
08:47
After a postive open, the market tested the light blue downtrend but this resistance was obviously too strong for the market.
On top of that, after reaching new high early in the session, the market lost all its early gains and closed below Friday's low (printing a bearish engulfment).
The Sigma Trend Index(STI) declined from'8' to '5'. The key question here is: "Will the STI remain above its zero line during this pullback?"

Conclusion:
Monday's price action confirmed our view we are heading for (at least) a consolidation phase.
Short term position:
- short 1 CAC at 3567.17
- short 1 NDX at 2655.07
Medium term positions:
- short 1.5 SPX at 1376.22
- short 1.5 CAC at 3103.87
Published by sigmatradingoscillator
-
dans
Market Analysis


