Overblog
Suivre ce blog Administration + Créer mon blog
28 mai 2012 1 28 /05 /mai /2012 09:42

We remain positive on the market after Friday's session.

Our key indicators continue to improve, our Sigma Trend Index (STI) increased from '-6' to'-5'.


model20120526.jpg


We have a SL in place at 1309.5


Current position: long at 1318.92


Have a nice day,

SigmaTradingOscillator

Partager cet article
Repost0
25 mai 2012 5 25 /05 /mai /2012 16:53

We don't like the kind of intraday triple top we have around 1324-1325.

We fear a sharp sell off if we can't move quickly above this resistance.


We set our SL at 1309.5.


We will short the market if we move below 1295

Partager cet article
Repost0
25 mai 2012 5 25 /05 /mai /2012 02:13

Looking at our Sigma Whole Market chart (aggregate of 16 US Indexes), we can notice some interesting things:


market20120524.jpg


- The lowest point of today's session = a succesful retest of the downtrend (dark blue line)

- Today's high was above yesterday's high

- Once again we did a reversal day (hammer = big line with small body)


At the same time, our key Sigma Trend Index (STI) continues to improve, moving from '-7' to '-6'. On top of that, our Trend Level (TL) moved into neutral territory (score of 3) versus bear camp the day before with a score of 2 (on a scale from 1 to 5, with 1 extremely bearish, 3 neutral, and 5 extremely bullish).


model20120524-copie-1.jpg


Our Breadth Index continues to improve too:


breadth20120524.jpg


Conclusion:

All our indicators are pointing in the same direction: a short term bottom is probably in place, and we are now in presence of a bounce back.

Now that the TL is neutral (score of 3), we expect an acceleration to the upside and a quick move to 1335-1345


Current position: long @ 1318.92


Have a nice day,

SigmaTradingOscillator

Partager cet article
Repost0
24 mai 2012 4 24 /05 /mai /2012 06:27

Yesterday was a very exciting day, and I think it gave us a lot of information:


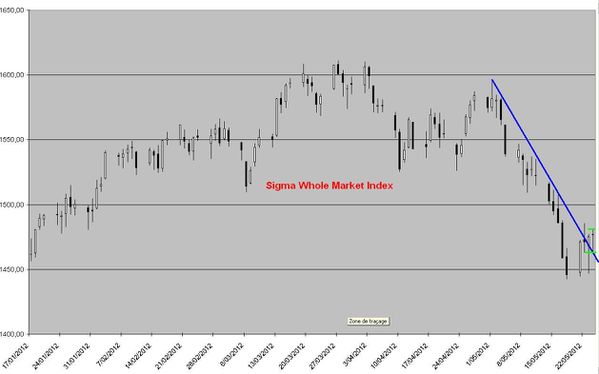
You can notice on the Sigma Whole Market Index  (representing the aggregate of 16 US indexes) that yesterday's low was higher than previous low which was also above than previous low (small horizontal red lines) => the downtrend was in a total lack of momentum and was unable to push below previous lows.

You can also notice we had a reversal day: long vertical line with a small "body" located at the top of a long vertical line. Such reversal days are identified by green boxes on our chat.

Very interesting too, we were able, for the first time, to close above the downtrend line (dark blue line).

=> Our chart tells us that there is a HIGH probability for a rebound NOW.

market20120523.jpg


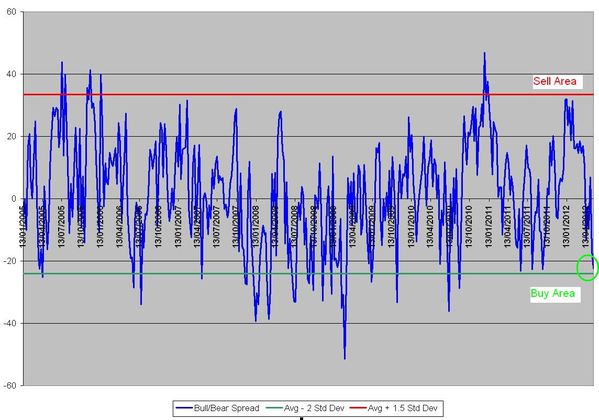
Looking at sentiment data, we can also notice that the bull/Bear spread released today by AAII is very close to buy zone:

bullbearspreas20120523.jpg


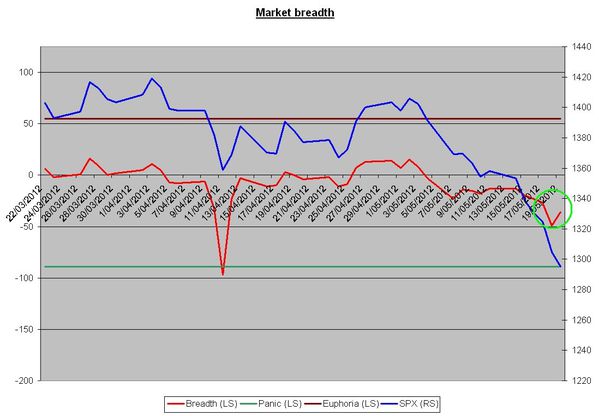
Looking at our models, we continue to notice that the situation is slightly improving, both the breadth index and the sigma trend index (STI) improved yesterday:

The sigma trend Index moved from -10 to -7, telling us the downtrend continues to weaken:


model20120523.jpg


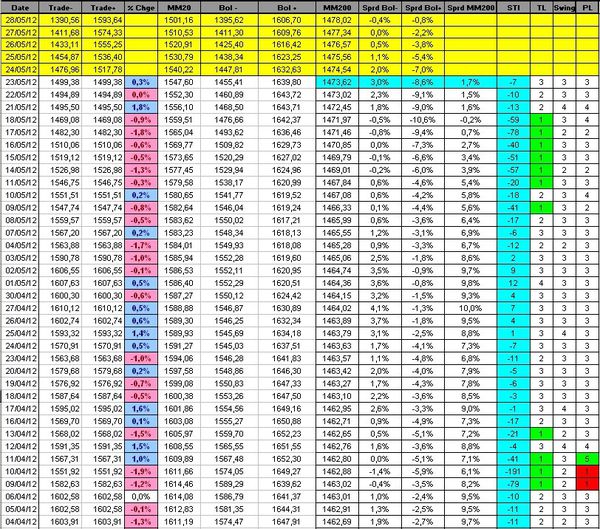
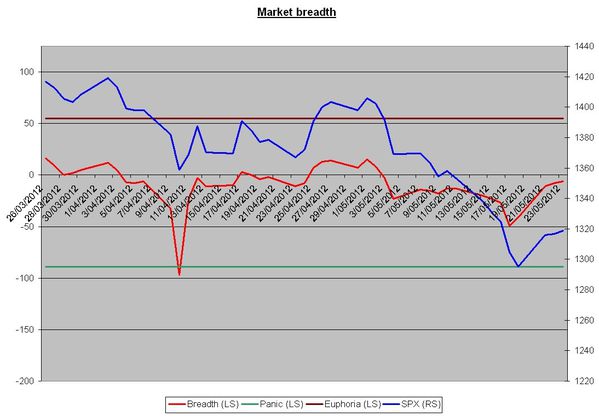
The Breadth Index (red line) improved too:


breadth20120523.jpg


Conclusion:

When we detected that the market was unable to move below previous low, we decided to cut our 1/2 short position at 1318.62 (=< 18 pts gain).

At the end of the session, thanks to the important reversal day, confirmed buy our improving signal, we decided to open a FULL LONG position @ 1318.92


Current position: long @ 1318.92


Have a nice day,

SigmaTradingOscillator

Partager cet article
Repost0
23 mai 2012 3 23 /05 /mai /2012 17:42

Market looks very uncertain, we are happy to close our 1/2 short position at 1300.62.

=> 1318.62 - 1300.62 = 18 (gain).


We will short again if we move below 1290 or if we reach 1336.

Within this range, we will stay on the sideline.

Partager cet article
Repost0
22 mai 2012 2 22 /05 /mai /2012 23:29

Following Friday's and Monday's session, we were expecting a bounce back in the 1335-1345 area.

Nevertheless, with today's "reversal", we fear that the next downleg could already have started.

For sure our key indicators improved slightly today, but as long as they remain in negative territory, they are pointing to a downtrend => we are in a rebound, not in a trend reversal (for the time being).


In this context, we decided to short half a position @ 1318.62 due to the sharp intraday reversal.

We will short the second half @ 1338


breadth20120522.jpg


model20120522.jpg


Current position: 1/2 short @ 1318.62


Have a nice day,

SigmaTradingOscillator

Partager cet article
Repost0
22 mai 2012 2 22 /05 /mai /2012 21:35

After reaching an intraday high @  1328.49, the SPX lost most of its gains.

We fear that next downleg has already started.

Our target area for this bounce back was around 1335-1345, but we don't want to be on the sidelines for the next downleg (all our medium term key indicators remain well in the red).


In this context, we open 1/2 short @ 1318.62

Partager cet article
Repost0
22 mai 2012 2 22 /05 /mai /2012 08:47

As we wrote during the week-end, some divergences were in the market at Friday's close.

Those divergences were confirmed  by an important rally yesterday.

We can notice that our Sigma Whole Market Index had an important white candle yesterday. It looks like the market would like to retest the horizantal green line.


market20120521.jpg


On top of that, our short term fear index moved (yesterday) from -34% to -1%, telling us there isn't anymore fear in the market.


sent20120521.jpg


Our Sigma Trend Index (STI) remains in negative territory, moving from -59 to -13. Nevertheless, with 6 consecutive sessions in oversold territory (six consecutive '1' for the Trend Level (TL)), we believe a short term bounce back could happen at anytime.

Our Swing Indicator (Swing) moved from 3 to 4 (on a scale from 1 to 5, with 3 = neutral), telling us that yesterday's move was bullish.


model20120521.jpg


Conclusion:

Friday's session gave us a red flag (=> we reduced our short by half), yesterday's session gave us a green light for a short term rally.

In this context, we decided to cut the remaining part of our short position at market close => 1345.06 - 1314.92 = 30.14 (gain).

We are now neutral because our medium term indicator (STI and breadth index) remain in negative territory, telling us that this move is probably a short term bounce back rather than a trend reversal.

We are waiting for good entry point in order to open a new position.


Current position: neutral


Have a nice day,

SigmaTradingOscillator

Partager cet article
Repost0
20 mai 2012 7 20 /05 /mai /2012 09:17

Our Breadth index slightly improved on Friday while the market continued to slide.

We haven't seen the final "wash out" we were waiting for, but due to this divergence, we decided to cut our short position by half at market close: 1345.06 - 1295.89 =  49.17 (gain).


breadth20120518.jpg


Current position: 1/2 short @ 1345.06


Have a nice day,

SigmaTradingOscillator

Partager cet article
Repost0
18 mai 2012 5 18 /05 /mai /2012 04:38

We start to detect some capitulation signs: some indicators are close to panic level.

We need, now, to monitor any reversal day in order to cut our short position, and to play a short term bounce back.


The Breadth Index is around '-50', we are waiting for a sharp decline into panic area (around '-90').


breadth20120517.jpg


With 38% of S&P500 stocks in panic mode (blue line), we are not far from capitulation.


euphoria20120517.jpg


Current position: short @ 1345.06


Have a nice day,

SigmaTradingOscillator

Partager cet article
Repost0

Presentation

  • : Le blog de sigmatradingoscillator
  • : Professionnel de la finance de marché depuis plus de 10ans, j'ai mis au point une série d'outils de trading me permettant de prendre et couper mes positions. Ici, j'écris un update quotidien sur la situation du CAC,DAX, Eurostoxx, SP500, Nasdaq100. Attention Les éléments repris dans ce blog représentent uniquement mon opinion personnelle et ne constituent en aucun cas une incitation au trading ou du conseil financier. Pour du conseil, consultez votre conseiller en placement
  • Contact

Disclaimer

NO MATERIAL HERE CONSTITUTES "INVESTMENT ADVICE" NOR IS IT A RECOMMENDATION TO BUY OR SELL ANY FINANCIAL INSTRUMENT, INCLUDING BUT NOT LIMITED TO STOCKS, COMMODITIES, OPTIONS, BONDS, FUTURES, OR BULLION. ACTIONS YOU UNDERTAKE AS A CONSEQUENCE OF OUR ANALYSIS, OPINION OR ADVERTISEMENT ON THIS SITE ARE YOUR SOLE RESPONSIBILITY.

FOR INVESTMENT ADVICE, PLAN A MEETING WITH A FINANCIAL ADVISOR IN ORDER TO ESTABLISH YOUR OWN RISK PROFILE.

Archives

Pages