Overblog
Suivre ce blog Administration + Créer mon blog
13 juin 2012 3 13 /06 /juin /2012 16:41

After a weak start, the market seems to resume its uptrend.

We fear that any reversal from here could be a "double top".


In this context, we uplift our stop order, in order to secure a positive outcome for our trade.


Current position: long @ 1307.77

Partager cet article
Repost0
13 juin 2012 3 13 /06 /juin /2012 05:38

The market was able to find some support around the key 50% retracement (from the recent bounce back).

As long as this level holds on, we remain comfortable with our 'abc' scenario (currently in 'c') and we stick with our view that the 1350 - 1360 area should be achievable in coming days.


Looking at our indicators, we can notice that the Sigma Trend Index (STI) moved from '-3' to '3'. (We need two consecutive closes in positive territory in order to confirm an uptrend).

But, today,  the most positive indicator was the Swing, moving from '2'  to '4' (on a scale from 1 to 5, 5 is best).


model20120612.jpg


Looking at our Breadth Index, we can notice that this indicator is also in positive territory (red line):


breadth20120612.jpg

Conclusion:

Our scenario is unchanged, here is our updated chart based on the Sigma Whole Market Index (Aggregate of 16 US indexes):

market20120612.jpg


Current position: long @ 1307.77 (stop @ 1308)


Have a nice day,

SigmaTradingOscillator

Partager cet article
Repost0
12 juin 2012 2 12 /06 /juin /2012 21:59

We have just created a twitter account in order to tell you what we are doing (in real time).


@SigmaTradingOsc


Thanks for this idea Scott.

Feedback and comments are always welcome.


Have a nice evening,

SigmaTradingOscillator

Partager cet article
Repost0
12 juin 2012 2 12 /06 /juin /2012 20:23

We uplift our stop loss from 1285 to 1308 (breakeven).


Current position: long at 1307.77


Partager cet article
Repost0
12 juin 2012 2 12 /06 /juin /2012 07:13

On Saturday, we posted two different scenario that could be under development.

It looks like the first one is currently under development. Here is the chart we posted on Saturday:


market20120608a


With this scenario in mind, we decided to cut our long position just after the European Market open at 1342.69.Then, we introduced a buy order at 1308 in order to take benefit of the expected pullback.

Our order was filled at the end of US session at 1307.77


Looking at our indicators, we can notice that the Sigma Trend Index (STI) fall back to '-2'. It is in line with a pullback scenario, but it must move (quickly) above the zero line.


model20120611.jpg


Conclusion:

We don't have new information coming from our indicators, but it looks like our scenario is under development. We believe the 1350 - 1360 area is achievable in coming days (on the SPX):


spx20120612.jpg


Current position: long @ 1307.77 (stop loss @ 1285)


Have a nice day,

SigmaTradingOscillator

Partager cet article
Repost0
11 juin 2012 1 11 /06 /juin /2012 22:01

Thanks to the late day sell off, our buy order was executed at 1307.77


Current position: long @ 1307.77

Partager cet article
Repost0
11 juin 2012 1 11 /06 /juin /2012 16:15

It looks like the scenario 1 (see Saturday's post) is under development.


=> We are waiting for 1308 in order to open a long position


Current position: no position

Partager cet article
Repost0
11 juin 2012 1 11 /06 /juin /2012 05:12

spx20120611.jpg


We believe the current move is nearly finished, so we close our long position @ 1342.69 [1342.69 - 1308.02 = 34.67 (gain)].

If our scenario is correct, we should have a "last" upswing around 1350.

We will use this "last" upswing in order to open a short position. (around 1350)


Current position: no position

Partager cet article
Repost0
9 juin 2012 6 09 /06 /juin /2012 11:36

We opened 2/3rd of a long position at 1308.02 and we introduced an order at 1301 for the last third. Why?

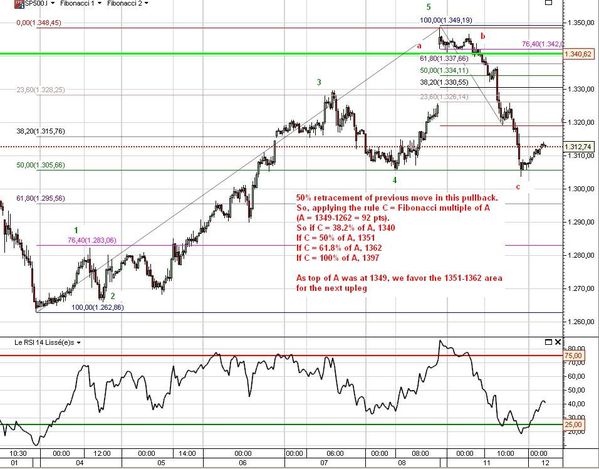
We are pretty comfortable that the market should retest de 1335 - 1360 area in coming days (or weeks), but we are not convinced that the pullback is already over.

So, we will increase our position if the market retest the 1290 - 1305 area.


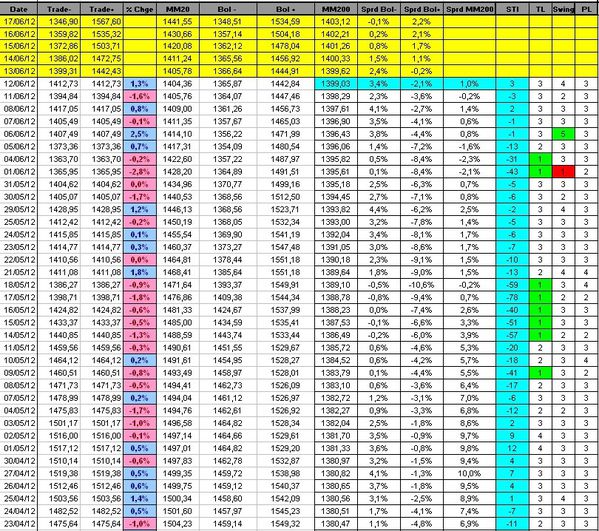
Looking at our indicators, we can notice that they are (all) in positive territory:

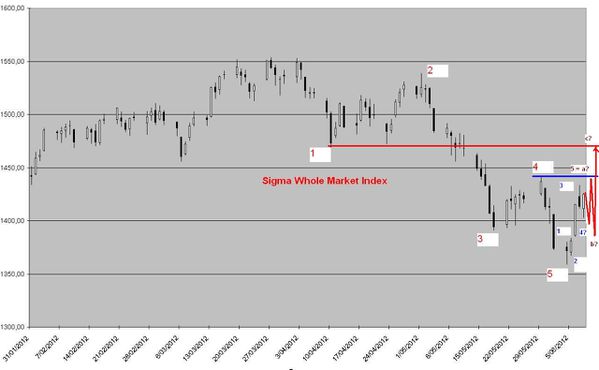
- The Sigma Trend Index moved from '-1' to '2', telling us the downtrend is over (at least for the short term) and that we should have more than a simple bounce back in this move.

- The Swing indicator and the Power Level (PL) are at '3' (neutral), but it is not a problem because we got a swing indicator at '5'(strong buy) on the 6th of June.


model20120608.jpg


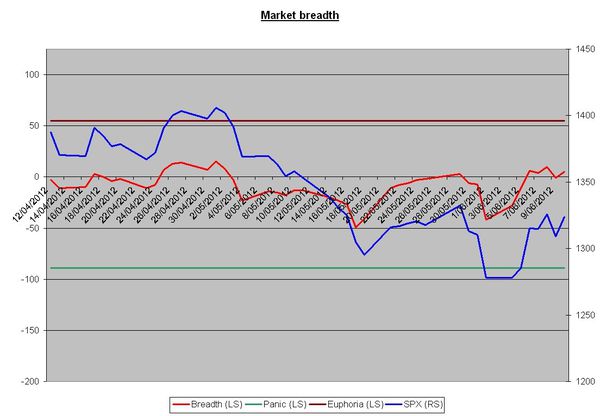
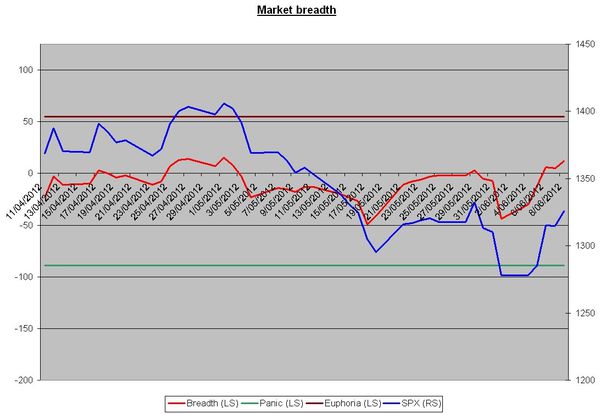
Looking at our Breadth Index (red line), we can see that it is also in positive territory:


breadth20120608.jpg


Conclusion:

All our indicators give us comfort in our short term bullish scenario.

Nevertheless, we have 2 different scenario for the "ultra short term" (1 or 2 days):


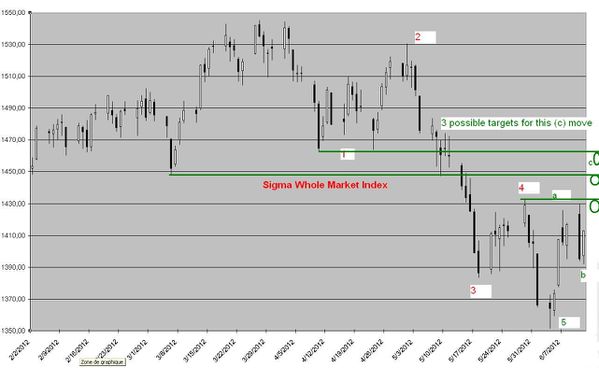
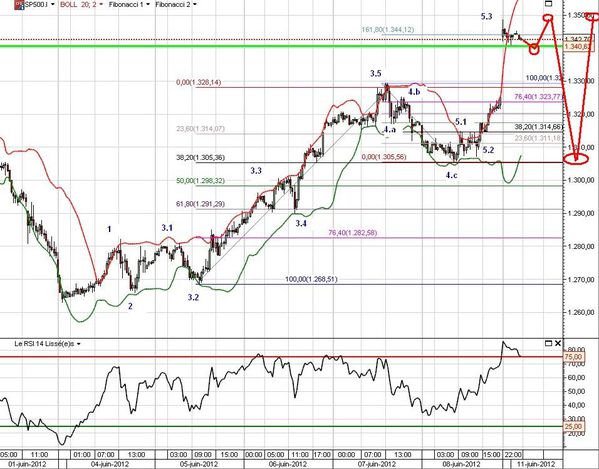
After 5 waves to the downside, the market is in a countertrend move in abc. We believe we are within the 'a' wave of this countertrend rally (subdivided in 5 subwaves).

We believe that the 3 first subwaves of 'a' are finished, but we are not sure than the fourth one is also finished.

Here are our 2 short term scenario:


Scenario 1:

market20120608a


Scenario 2:

market20120608b


If we move to 1301 (scenario 2), we will increase our exposure to the SPX (with a stop loss at 1285).

If we move on a straight line to 1335 (scenario 1), we will cut our long, waiting for a pullback in order to re-enter the market with a target at 1360.


current position: 2/3 long at 1308.02


Have a nice day,

SigmaTradingOscillator

Partager cet article
Repost0
8 juin 2012 5 08 /06 /juin /2012 16:00

We will buy our last third (of long position) at 1301 rather than 1298

Partager cet article
Repost0

Presentation

  • : Le blog de sigmatradingoscillator
  • : Professionnel de la finance de marché depuis plus de 10ans, j'ai mis au point une série d'outils de trading me permettant de prendre et couper mes positions. Ici, j'écris un update quotidien sur la situation du CAC,DAX, Eurostoxx, SP500, Nasdaq100. Attention Les éléments repris dans ce blog représentent uniquement mon opinion personnelle et ne constituent en aucun cas une incitation au trading ou du conseil financier. Pour du conseil, consultez votre conseiller en placement
  • Contact

Disclaimer

NO MATERIAL HERE CONSTITUTES "INVESTMENT ADVICE" NOR IS IT A RECOMMENDATION TO BUY OR SELL ANY FINANCIAL INSTRUMENT, INCLUDING BUT NOT LIMITED TO STOCKS, COMMODITIES, OPTIONS, BONDS, FUTURES, OR BULLION. ACTIONS YOU UNDERTAKE AS A CONSEQUENCE OF OUR ANALYSIS, OPINION OR ADVERTISEMENT ON THIS SITE ARE YOUR SOLE RESPONSIBILITY.

FOR INVESTMENT ADVICE, PLAN A MEETING WITH A FINANCIAL ADVISOR IN ORDER TO ESTABLISH YOUR OWN RISK PROFILE.

Archives

Pages